Engage NY Eureka Math Grade 6 Module 6 Lesson 9 Answer Key
Eureka Math Grade 6 Module 6 Lesson 9 Example Answer Key
Example 1: Variability
In Lesson 8, Robert wanted to decide where he would rather move (New York City or San Francisco). He planned to make his decision by comparing the average monthly temperatures for the two cities. Since the mean of the average monthly temperatures for New York City and the mean for San Francisco turned out to be about the same, he decided instead to compare the cities based on the variability in their monthly average temperatures.
He looked at the two distributions and decided that the New York City temperatures were more spread out from their mean than were the San Francisco temperatures from their mean.
Exercises 1 – 3:
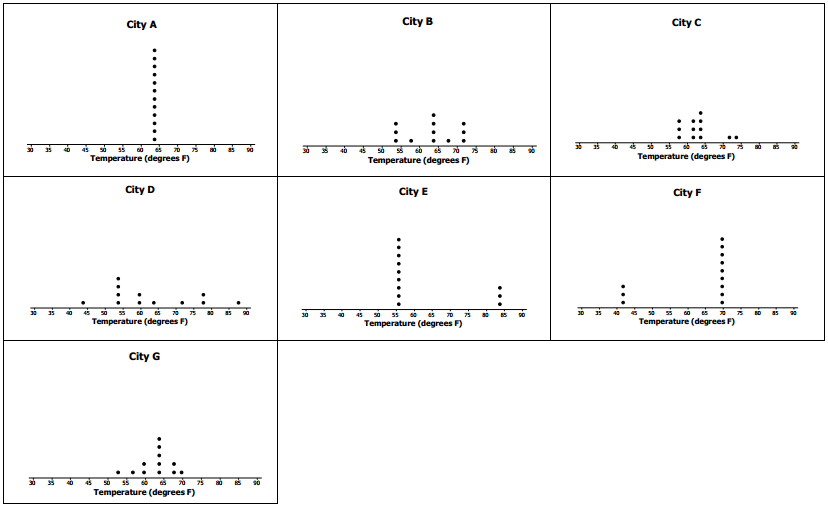
The following temperature distributions for seven other cities all have a mean monthly temperature of approximately 63 degrees Fahrenheit. They do not have the same variability.
Exercise 1.
Which distribution has the smallest variability? Explain your answer.
Answer:
City A has the smallest variability because all the data points are the same.
Exercise 2.
Which distribution or distributions seem to have the most variability? Explain your answer.
Answer:
One or more of the following is acceptable: Cities D, E, and F. They appear to have data points that are the most
spread out.
Exercise 3.
Order the seven distributions from least variability to most variability. Explain why you listed the distributions in
the order that you chose.
Answer:
Several orderings are reasonable. Focus on student’s explanations for choosing the order, making sure that the ordering is consistent with an understanding of spread. There are some that will be hard for students to order, and if students have trouble, use this opportunity to point out that it would be useful to have a more formal way to measure variability in a data set. Such a measure is developed in Example 2.
Example 2: Measuring Variability
Based on just looking at the distributions, there are different orderings of variability that seem to make some sense. Sabina is interested in developing a formula that will produce a number that measures the variability in a data distribution. She would then use the formula to measure the variability in each data set and use these values to order the distributions from smallest variability to largest variability. She proposes beginning by looking at how far the values in a data set are from the mean of the data set.
Exercises 4 – 5:
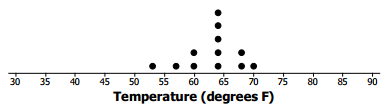
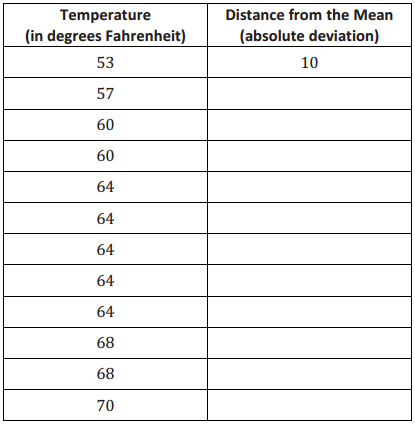
The dot plot for the monthly temperatures in City G is shown below. Use the dot plot and the mean monthly temperature of 63 degrees Fahrenheit to answer the following questions.
City G
Exercise 4.
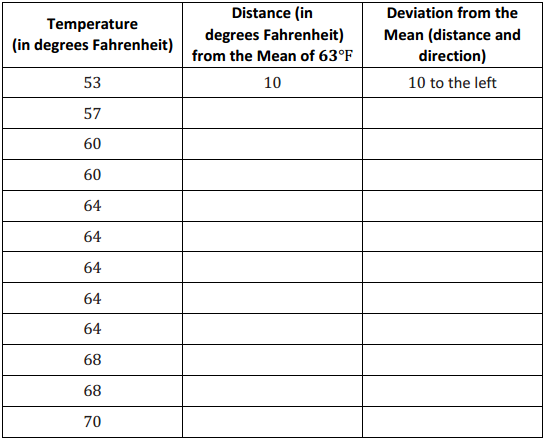
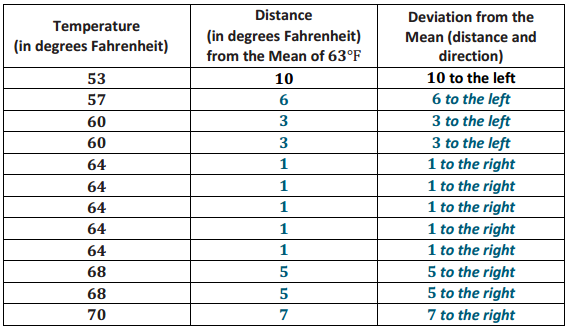
Fill in the following table for City G’s temperature deviations.
Answer:
Exercise 5.
What is the sum of the distances to the left of the mean? What is the sum of the distances to the right of the mean?
Answer:
The sum of the distances to the left of the mean is 10 + 6 + 3 + 3 = 22. The sum of the distances to the right of the mean is 1 + 1 + 1 + 1 + 1 + 5 + 5 + 7 = 22.
Example 3: Finding the Mean Absolute Deviation (MAD)
Sabina notices that when there is not much variability in a data set, the distances from the mean are small and that when there is a lot of variability in a data set, the data values are spread out and at least some of the distances from the mean are large. She wonders how she can use the distances from the mean to help her develop a formula to measure variability.
Exercises 6 – 7:
Exercise 6.
Use the data on monthly temperatures for City G given in Exercise 4 to answer the following questions.
a. Fill in the following table.
Answer:
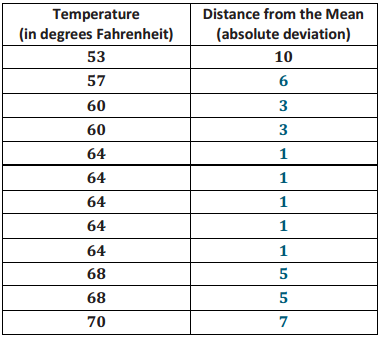
b. The absolute deviation for a data value is its distance from the mean of the data set. For example, for the first temperature value for City G (53 degrees), the absolute deviation is 10. What !s the sum of the absolute deviations?
Answer:
The sum of the absolute deviations is 10 + 6 + 3 + 3 + 1 + 1 + 1 + 1 + 1 + 5 + 5 + 7 = 44.
c. Sabina suggests that the mean of the absolute deviations (the mean of the distances) could be a measure of the variability in a data set. Its value is the average distance of the data values from the mean of the monthly temperatures. It is called the mean absolute deviation and is denoted by the letters MAD. Find the MAD for this data set of City G’s temperatures. Round to the nearest tenth.
Answer:
The MAD (mean absolute deviation) is \(\frac{44}{12^{\prime}}\) or 3.7 degrees to the nearest tenth of a degree.
d. Find the MAD values in degrees Fahrenheit for each of the seven city temperature distributions and use the values to order the distributions from least variability to most variability. Recall that the mean for each data set is 63 degrees Fahrenheit. Looking only at the distributions, does the list that you made in Exercise 2 match the list made by ordering MAD values?

Answer:
If time is a factor in completing this lesson, assign cities to individual students. After each student has calculated the mean deviation, organize the results for the whole class. Direct students to calculate the MAD to the nearest tenth of a degree.
MAD values (in °F):
City A = 0
City B = 5.3
City C = 3.2
City D = 10.5
City E = 10.5
City F = 10.5
City G = 3.7
The order from least to greatest is A, C, G, B, and D, E, and F(all tied).
e. Which of the following is a correct interpretation of the MAD?
i. The monthly temperatures in City G are all within 3. 7 degrees from the approximate mean of 63 degrees.
ii. The monthly temperatures in City G are, on average, 3. 7 degrees from the approximate mean temperature of 63 degrees.
iii. All of the monthly temperatures in City G differ from the approximate mean temperature of 63 degrees by 3. 7 degrees.
Answer:
The answer is (ii). Remind students that the MAD is an average of the distances from the mean, so some distances may be smaller and some larger than the value of the MAD. Point out that the distances from the mean for City G were not all equal to 3.7 and that some were smaller (for example, the distances of 1 and 3) and that some were larger (for example, the distances of 5 and 10).
Exercise 7.
The dot plot for City A’s temperatures follows.
City A
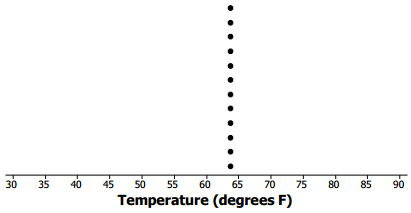
a. How much variability is there in City A’s temperatures? Why?
Answer:
There is no variability in City A’s temperatures. The absolute deviations (distances from the mean) are all 0.
b. Does the MAD agree with your answer In part (a)?
Answer:
The MAD does agree with my answer from part (a). The value of the MAD is 0.
Eureka Math Grade 6 Module 6 Lesson 9 Problem Set Answer Key
Question 1.
Suppose the dot plot on the left shows the number of goals a boys’ soccer team has scored in six games so far this
season, and the dot plot on the right shows the number of goals a girls’ soccer team has scored in six games so far
this season. The mean for both of these teams is 3.
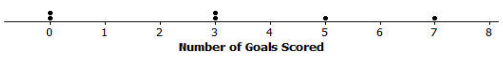
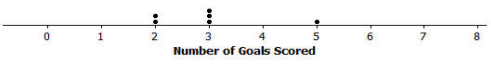
a. Before doing any calculations, which dot plot has the larger MAD? Explain how you know.
Answer:
The graph of the boys’ team has a larger MAD because the data are more spread out and have the larger distances from the mean.
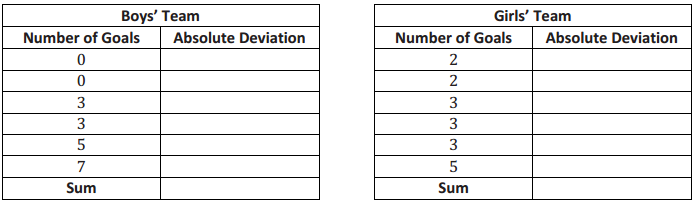
b. Use the following tables to find the MAD for each distribution. Round your calculations to the nearest hundredth.
Answer:
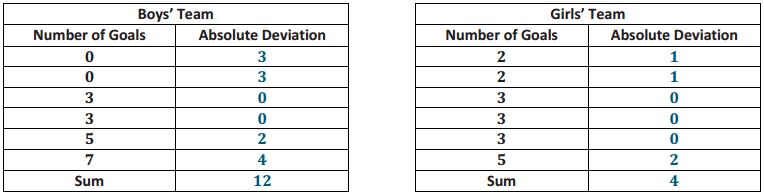
The MAD for the boy’s team is 2 goals because \(\frac{12}{6}\) = 2. The MAD for the girls’ team is 0.67 goal because \(\frac{4}{6}\) ≈ 0.67
c. Based on the computed MAD values, for which distribution is the mean a better indication of a typical value? Explain your answer.
Answer:
The mean is a better indicator of a typical value for the girl’s team because the measure of variability given by the MAD is lower (0.67 goal) than the boys’ MAD (2 goals).
Question 2.
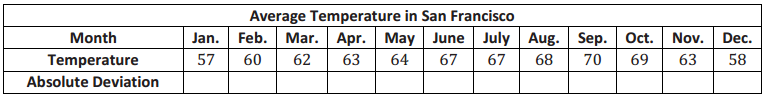
Recall Robert’s problem of deciding whether to move to New York City or to San Francisco. A table of temperatures (in degrees Fahrenheit) and absolute deviations for New York City follows:
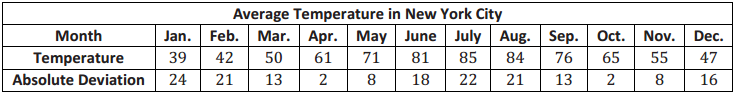
a. The absolute deviations for the monthly temperatures are shown in the above table. Use this information to calculate the MAD. Explain what the MAD means in words.
Answer:
The sum of the absolute deviations is 168. The MAD is the average of the absolute deviations. The MAD is 14 degrees because \(\frac{168}{12}\) = 14. On average, the monthly temperatures in New York City differ from the mean of 63 degrees Fahrenheit by 14 degrees.
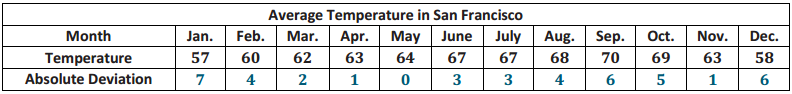
b. Complete the following table, and then use the values to calculate the MAD for the San Francisco data distribution.
Answer:
The sum of the absolute deviations is 42. The MAD is the mean of the absolute deviations. The MAD is 3.5 degrees because \(\frac{42}{12}\) = 3. 5.
c. Comparing the MAD values for New York City and San Francisco, which city would Robert choose to move to if he is interested in having a lot of variability in monthly temperatures? Explain using the MAD.
Answer:
New York City has a MAD of 14 degrees, as compared to 3.5 degrees in San Francisco. Robert should choose
New York City if he wants to have more variability in monthly temperatures.
Question 3.
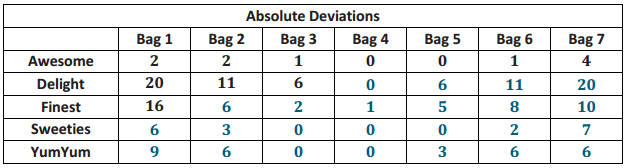
Consider the following data of the number of green jelly beans in seven bags sampled from each of five different candy manufacturers (Awesome, Delight, Finest, Sweeties, YumYum). Note that the mean of each distribution is 42 green jelly beans.
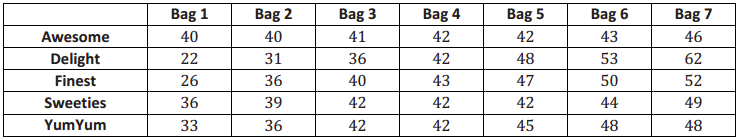
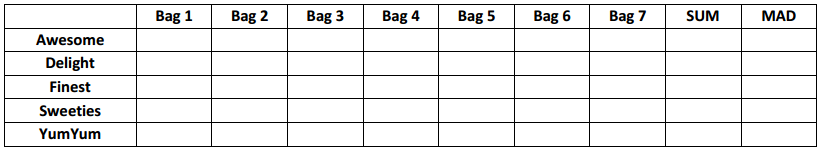
a. Complete the following table of the absolute deviations for the seven bags for each candy manufacturer.
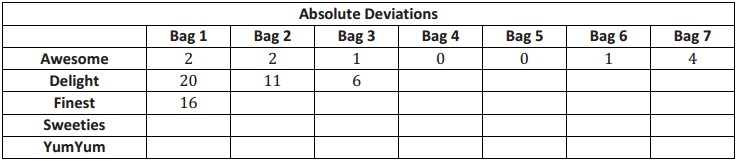
Answer:
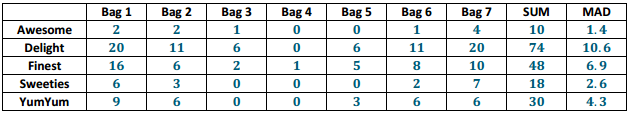
b. Based on what you learned about MAD, which manufacturer do you think will have the lowest MAD? Calculate the MAD for the manufacturer you selected.
Answer:
Use the MAD for each manufacturer to evaluate student’s responses.
Eureka Math Grade 6 Module 6 Lesson 9 Exit Ticket Answer Key
Question 1.
The mean absolute deviation (MAD) is a measure of variability for a data set. What does a data distribution look like if its MAD equals zero? Explain.
Answer:
If the MAD is zero, then all of the absolute deviations are zero. The MAD measures the average distance from the mean, and the distance is never negative. The only way the MAD could average to zero is if all the absolute deviations are zero. For example, City A had a dot plot where all of the temperatures were the same. Because all of the temperatures were the same, all of the absolute deviations were zero, which indicates that there was no variability in the temperatures.
Question 2.
Is it possible to have a negative value for the MAD of a data set?
Answer:
Because a MAD is the average of distances, which can never be negative, the MAD is always zero or a positive number.
Question 3.
Suppose that seven students have the following numbers of pets: 1, 1, 1, 2, 4, 4, 8.
a. The mean number of pets for these seven students is 3 pets. Use the following table to find the MAD for this distribution of number of pets.
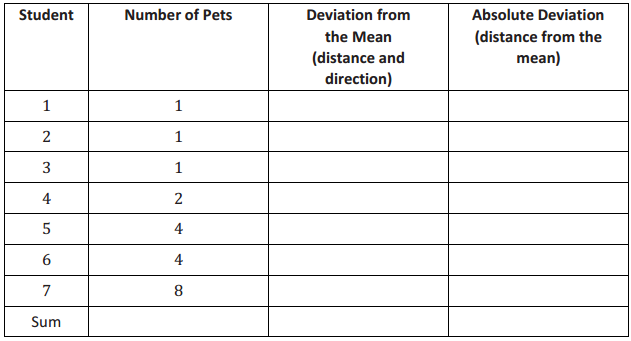
Answer:
\(\frac{14}{7}\)
The MAD number of pets is 2.
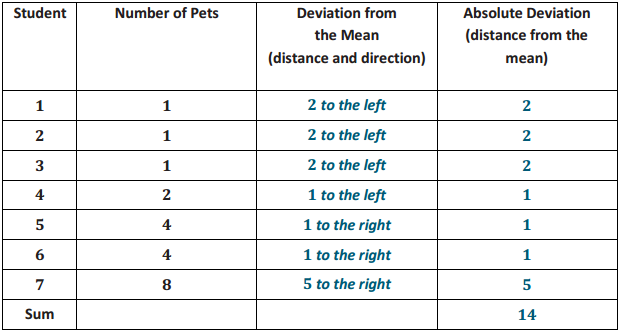
b. Explain in words what the MAD means for this data set.
Answer:
On average, the number of pets for these students differs by 2 from the mean of 3 pets.