Engage NY Eureka Math Grade 6 Module 6 Lesson 20 Answer Key
Eureka Math Grade 6 Module 6 Lesson 20 Example Answer Key
Example 1: The Great Lakes Yellow Perch
Scientists collected data from many yellow perch because they were concerned about the survival of the yellow perch. What data do you think researchers might want to collect about these perch?
Answer:
Answers will vary. Anticipate that students also suggest collecting data on physical characteristics of the fish, such as weight, length, etc. Some students may say they would look for evidence of disease. Students might also suggest collecting data on age, but this might be difficult to determine. As this lesson progresses, students see that it is possible to estimate the age of a perch from its length.
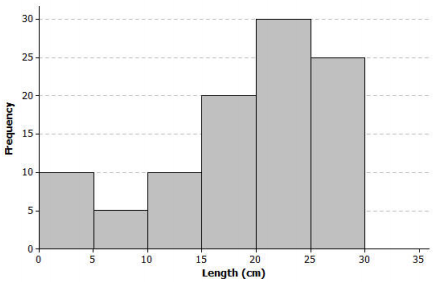
Scientists captured yellow perch from a lake in this region. They recorded data on each fish and then returned each fish to the lake. Consider the following histogram of data on the length (in centimeters) for a sample of yellow perch.
Exercises 1 – 11:
Scientists were concerned about the survival of the yellow perch as they studied the histogram.
Exercise 1.
What statistical question could be answered based on this data distribution?
Answer:
Answers will vary. A possible statistical question would be, “What is a typical length of the Great Lakes yellow perch?”
Exercise 2.
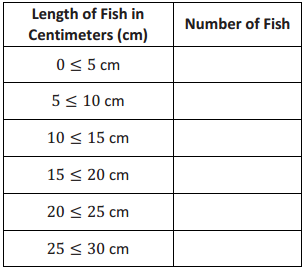
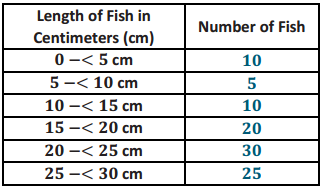
Use the histogram to complete the following table.
Answer:
Exercise 3.
The length of each fish in the sample was measured and recorded before the fish was released back into the lake. How many yellow perch were measured in this sample?
Answer:
100 fish were measured in this sample.
Exercise 4.
Would you describe the distribution of the lengths of the fish in the sample as a skewed distribution or as an approximately symmetric distribution? Explain your answer.
Answer:
The data distribution is a skewed distribution with the tail to the left.
Exercise 5.
What percentage of fish in the sample were less than 10 centimeters in length?
Answer:
15 of the 100 fish measured in this sample had a length of less than 10 centimeters, so 15% of the fish are less than 10 centimeters.
Exercise 6.
If the smallest fish In this sample was 2 centimeters in length, what is your estimate of an interval of lengths that would contain the lengths of the shortest 25% of the fish? Explain how you determined your answer.
Answer:
25% of the fish ore represented in the first three intervals. If the smallest value in the first interval is known, then an estimate of the interval of the smallest 25% of the fish is 2 centimeters to 15 centimeters. determined this by considering the histogram bars at the low end and looking for intervals that would represent 25 fish.
Exercise 7.
If the length of the largest yellow perch was 29 centimeters, what is your estimate of an interval of lengths that would contain the lengths of the longest 25% of the fish?
Answer:
In a similar way, there are 25 fish in the interval 25 to 30 centimeters in length. If the longest fish were measured at 29 centimeters, then an estimate of an interval containing the upper 25% would be 25 to 29 centimeters.
Exercise 8.
Estimate the median length of the yellow perch in the sample. Explain how you determined your estimate.
Answer:
To estimate the median length, I would Identify o length for which approximately 50% of the fish would be above and approximately 50% of the fish would be below. Starting from the smallest lengths, an estimate of the median would be located within the 20 to 25 centimeters interval.
The same interval would be identified if started with the largest lengths. As the actual values of the lengths of the fish are not known, any estimate within that interval would be a good estimate. For example, an estimate of 23 centimeters would be a good estimate.
Exercise 9.
Based on the shape of this data distribution, do you think the mean length of a yellow perch would be greater than, less than, or the same as your estimate of the median? Explain your answer.
Answer:
Because the data distribution is skewed, the smaller lengths will pull an estimate of the mean to the left of the median. Therefore, an estimate of the mean would be less than the estimate of the median.
Exercise 10.
Recall that the mean length is the balance point of the distribution of lengths. Estimate the mean length for this sample of yellow perch.
Answer:
Answers will vary, but an estimate of a length in the 15 to 20 centimeters interval would show an understanding of this idea. For example, 17 or 18 centimeters would be a good estimate of the mean.
Exercise 11.
The length of a yellow perch is used to estimate the age of the fish. Yellow perch typically grow throughout their lives. Adult yellow perch have lengths between 10 and 30 centimeters. How many of the yellow perch in this sample would be considered adult yellow perch? What percentage of the fish in the sample are adult fish?
Answer:
85 fish are counted in the intervals that represent 10 to 30 centimeters. Therefore, 85% of the fish in this sample are estimated to be adult fish.
Example 2: What Would a Better Distribution Look Like?
Yellow perch are part of the food supply of larger fish and other wildlife in the Great Lakes region. Why do you think that the scientists worried when they saw the histogram of fish lengths given previously in Exercise 2.
Answer:
The small percentage of short fish means that there are fewer young yellow perch than older yellow perch.
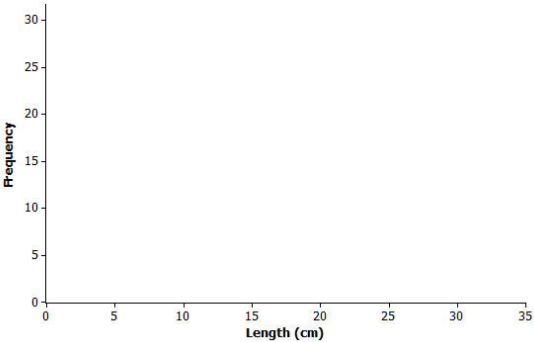
Sketch a histogram representing a sample of 100 yellow perch lengths that you think would indicate the perch are not in danger of dying out.
Answer:
Answers will vary, but students’ histograms should have a larger number of fish with short lengths.
Exercises 12 – 17: Estimating the Variability in Yellow Perch Lengths
You estimated the median length of yellow perch from the first sample in Exercise 8. It is also useful to describe variability in the length of yellow perch. Why might this be important? Consider the following questions:
Exercise 12.
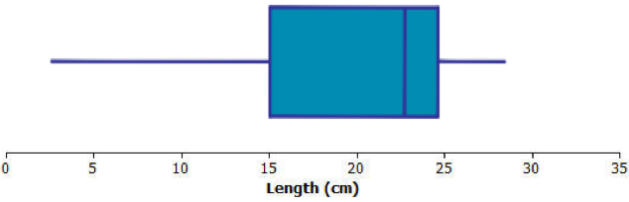
In several previous lessons, you described a data distribution using the five-number summary. Use the histogram and your answers to the questions in previous exercises to provide estimates of the values for the five-number summary for this sample:
Minimum (mm) value =
Ql value =
Median =
Q3 value =
Maximum (max) value =
Answer:
Minimum (min) value = 2 centimeters
Q1 value = 15 centimeters
Median = 23 centimeters
Q3 value = 25 centimeters
Maximum (max) value = 29 centimeters
Because students are estimating these values from a histogram, expect a variety of reasonable answers. Any values that are reasonably close to the values shown here should be considered acceptable.
Exercise 13.
Based on the five-number summary, what is an estimate of the value of the interquartile range (IQR) for this data distribution?
Answer:
Based on the above estimates, an estimate of the interquartile range (IQR) would be as follows:
25 centimeters – 15 centimeters = 10 centimeters.
Actual student answers will vary depending on their answers to Exercise 12.
Exercise 14.
Sketch a box plot representing the lengths of the yellow perch in this sample.
Answer:
Exercise 15.
Which measure of center, the median or the mean, Is closer to where the lengths of yellow perch tend to cluster?
Answer:
For a skewed distribution, the median is closer to where the lengths of yellow perch tend to cluster.
Exercise 16.
What value would you report as a typical length for the yellow perch in this sample?
Answer:
Encourage students to use the estimate of the median value in the previous questions as o typical value for the yellow perch.
Exercise 17.
The mean absolute deviation (or MAD) or the interquartile range (IQR) is used to describe the variability in a data distribution. Which measure of variability would you use for this sample of perch? Explain your answer.
Answer:
When the median is selected as the measure of center for a typical value (because the distribution is not approximately symmetric), then the interquartile range would be selected as the measure of variability. In this case, 10 centimeters, or the IQR determined in Exercise 13, would be the measure of the variability.
Eureka Math Grade 6 Module 6 Lesson 20 Problem Set Answer Key
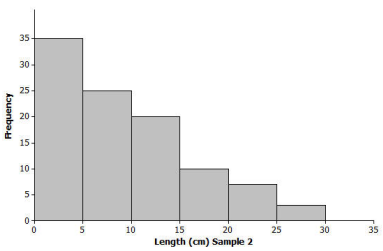
Another sample of Great Lake yellow perch from a different lake was collected. A histogram of the lengths for the fish in this sample is shown below.
Question 1.
If the length of a yellow perch is an indicator of its age, how does this second sample differ from the sample you investigated in the exercises? Explain your answer.
Answer:
The second sample has more fish with lengths in the intervals corresponding to shorter lengths. Therefore, more of the fish are younger.
Question 2.
Does this histogram represent a data distribution that is skewed or that is nearly symmetrical?
Answer:
This distribution is also skewed. However, the tail of this distribution is to the right, or toward the longer lengths.
Question 3.
What measure of center would you use to describe a typical length of a yellow perch in this second sample? Explain your answer.
Answer:
Students should recommend the median of the data distribution is a description of a typical value of the length of the yellow perch because this distribution is skewed.
Question 4.
Assume the smallest perch caught was 2 centimeters in length, and the largest perch caught was 29 centimeters in length. Estimate the values in the five-number summary for this sample:
Answer:
Q1, Q3, and median values are not as clear cut in this distribution as in Exercise 4, so allow a wider range of acceptable answers.
Minimum (min) value = 2 centimeters
Q1 value = 4 centimeters (a value greater than 2 but within the interval of 0 to 5 centimeters)
Median value = 7 centimeters (o value within the interval of 5 to 10 centimeters)
Q3 value = 12 centimeters (a value within the interval of 10 to 15 centimeters)
Maximum (max) value = 29 centimeters.
Question 5.
Based on the shape of this data distribution, do you think the mean length of a yellow perch from this second sample would be greater than, less than, or the same as your estimate of the median? Explain your answer.
Answer:
An estimate of the mean would be greater than the median length because the values in the tail, or to the right of the median, pull the mean in that direction. Consider estimating the mean as the balance point of this distribution.
(If students have problems with estimating the balance point, consider providing them with a representation similar to the representation used to introduce a balance point in earlier lessons. Use a ruler with coins (or weights) taped to locations that would represent a skewed distribution. This representation may help students sense the point of balance.)
Question 6.
Estimate the mean value of this data distribution.
Answer:
An estimate of the mean would be a value slightly larger than the median value. For example, a mean of 10 or 11 centimeters would be a reasonable estimate of a balance point.
Question 7.
What is your estimate of a typical length of a yellow perch in this sample? Did you use the mean length from Problem 5 for this estimate? Explain why or why not.
Answer:
Since the median was selected as the appropriate estimate of a measure of center, a value of 7 centimeters (or whatever students used to estimate the median) would be an estimate of a typical value for a yellow perch from this sample.
Question 8.
Would you use the MAD or the IQR to describe variability in the length of Great Lakes yellow perch in this sample? Estimate the value of the measure of variability that you selected.
Answer:
Students should use the IQR to describe the variability because the data distribution is skewed, and the median was used as a measure of a typical value. An estimate of the IQR based on the above estimates would be as follows:
12 centimeters – 4 centimeters = 8 centimeters.
Eureka Math Grade 6 Module 6 Lesson 20 Exit Ticket Answer Key
Question 1.
Great Lake yellow perch continue to grow until they die. What does the histogram in Example 1 indicate about the ages of the perch in the sample?
Answer:
The histogram indicates that most of the perch are in the intervals corresponding to the longest lengths. Because length is related to age, the histogram indicates that there are more older fish.
Question 2.
What feature of the histogram in Example 1 indicates that the values of the mean and the median of the data distribution will not be equal?
Answer:
The histogram indicates that the shape of the data distribution is skewed. For skewed distributions, the mean and the median are not equal.
Question 3.
Adult yellow perch have lengths between 10 and 30 centimeters. Would a perch with a length equal to the median length be classified as an adult or a pre-adult fish? Explain your answer.
Answer:
A perch equal to the median length would be classified as an adult fish. The median is estimated to be between 20 and 25 centimeters in length. Adult fish are 10 centimeters or more in length.