Engage NY Eureka Math 3rd Grade Module 6 Lesson 1 Answer Key
Eureka Math Grade 3 Module 6 Lesson 1 Problem Set Answer Key
Question 1.
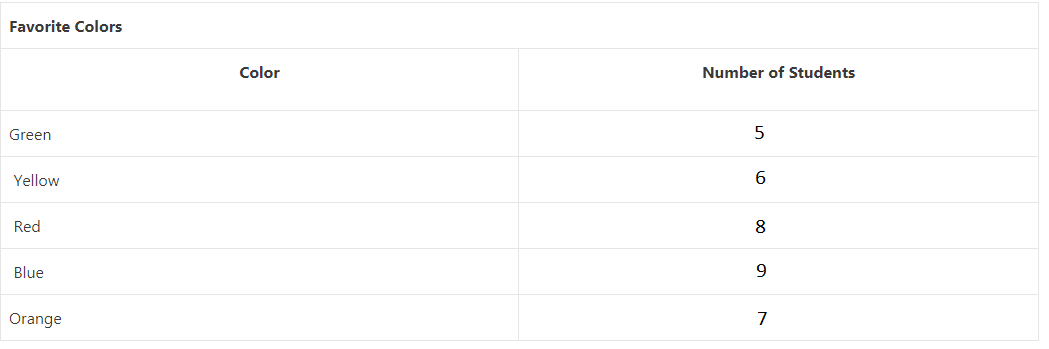
“What is your favorite color?” Survey the class to complete the tally chart below.
| Favorite Colors | |
| Color |
Number of Students |
| Green | |
| Yellow | |
| Red | |
| Blue | |
| Orange | |
Answer:
Question 2.
Use the tally chart to answer the following questions.
a. How many students chose orange as their favorite color?
b. How many students chose yellow as their favorite color?
c. Which color did students choose the most? How many students chose it?
d. Which color did students choose the least? How many students chose it?
e. What is the difference between the number of students in parts (c) and (d)? Write a number sentence to show your thinking.
f. Write an equation to show the total number of students surveyed on this chart.
Answer:
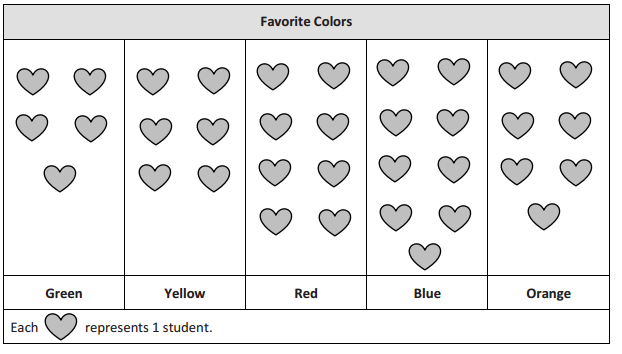
a. 7 students chose orange as their favorite color.
b. 6 students chose yellow as their favorite color
c. Blue color students choose the most. total 9 students choose blue color.
d. Green color students choose the least. 5 students chose it.
e. the difference between the number of students in parts (c) and (d) is Blue color students choose the most. total 9 students choose blue color.
and Green color students choose the least. 5 students chose it.
f. the total number of students surveyed on this chart
add all the numbers who choose the colors green yellow red blue orange is 5+6+8+9+7 we get 35
Question 3.
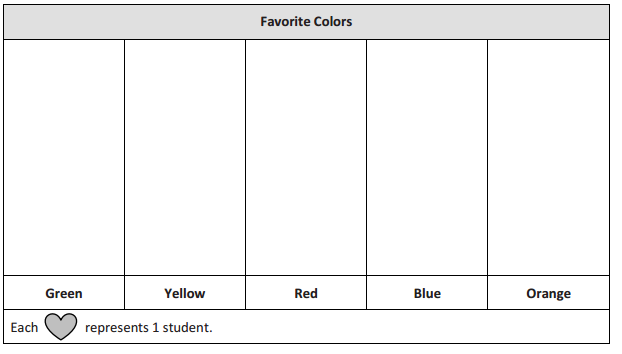
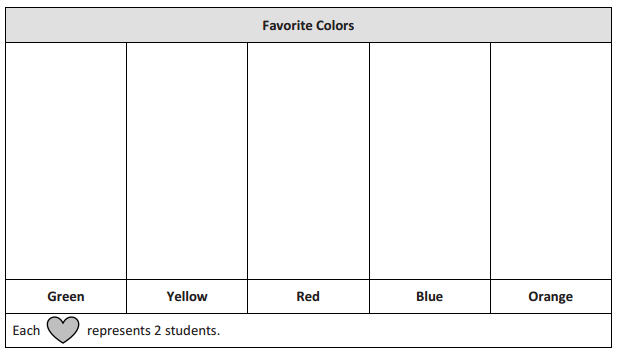
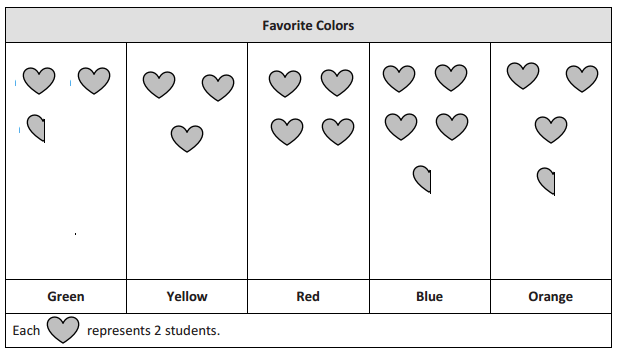
Use the tally chart in Problem 1 to complete the picture graphs below.
a.
b.
Answer:
a.
b.
Question 4.
Use the picture graph in Problem 3(b) to answer the following questions.
a. What does each ![]() represent?
represent?
b. Draw a picture and write a number sentence to show how to represent 3 students in your picture graph.
c. How many students does ![]() represent? Write a number sentence to show how you know.
represent? Write a number sentence to show how you know.
d. How many more ![]() did you draw for the color that students chose the most than for the color that students chose the least? Write a number sentence to show the difference between the number of votes for the color that students chose the most and the color that students chose the least.
did you draw for the color that students chose the most than for the color that students chose the least? Write a number sentence to show the difference between the number of votes for the color that students chose the most and the color that students chose the least.
Answer:
a. Each ![]() represents 2 students.
represents 2 students.
b. Draw a picture and write a number sentence to show how to represent 3 students in your picture graph.

Each represents ![]() 2 students
2 students  represents 1 student.
c. ![]() represents 14 students.
represents 14 students.
we know each ![]() represents 2 students. as given in question we have 7
represents 2 students. as given in question we have 7 ![]() so 7×2 we get 14 students
so 7×2 we get 14 students
d. total 9 students choose blue color.
and Green color students choose the least. 5 students chose it.
Eureka Math Grade 3 Module 6 Lesson 1 Exit Ticket Answer Key
The picture graph below shows data from a survey of students’ favorite sports.
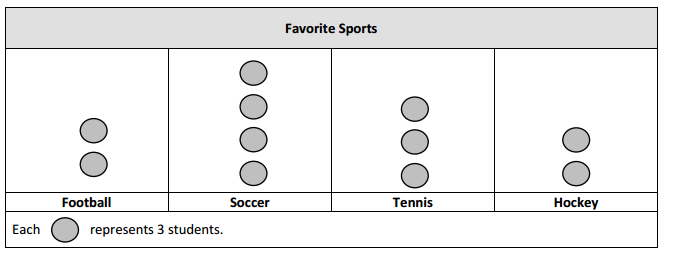
a. The same number of students picked ________ and ________ as their favorite sport.
b. How many students picked tennis as their favorite sport?
c. How many more students picked soccer than tennis? Use a number sentence to show your thinking.
d. How many total students were surveyed?
Answer:
a. The same number of students picked Hockey and Football as their favorite sport.
b. 3 students picked tennis as their favorite sport
c. one student picked soccer than tennis
Total students who picked Soccer is 4 and the total number of students who picked tennis is 3
d. total of 11 students were surveyed
Eureka Math Grade 3 Module 6 Lesson 1 Homework Answer Key
Question 1.
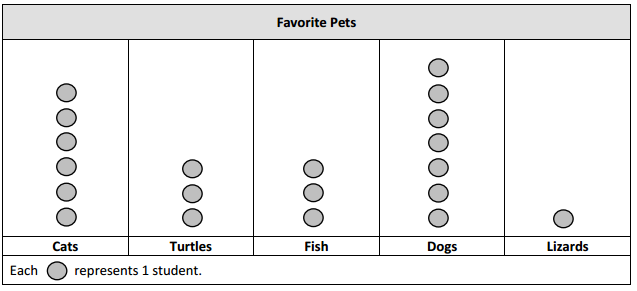
The tally chart below shows a survey of students’ favorite pets. Each tally mark represents 1 student.
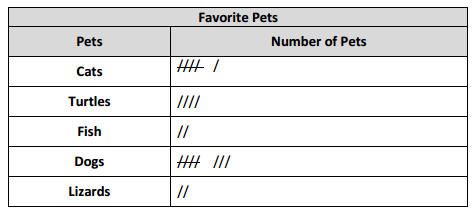
The chart shows a total of _______ students.
Answer: The chart shows a total of 22 students.
Explanation:
Cats 7 students
Turtles 4 students
Fish 2 students
Dogs 8 students
Lizards 2 students
By adding we get a total of 22 students.
Question 2.
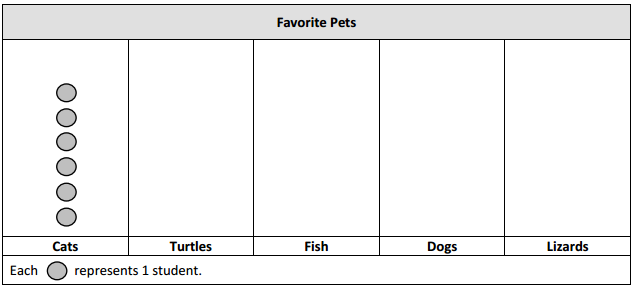
Use the tally chart in Problem 1 to complete the picture graph below. The first one has been done for you.
a. The same number of students picked _______ and _______ as their favorite pet.
b. How many students picked dogs as their favorite pet?
c. How many more students chose cats than turtles as their favorite pet?
Answer:
a. The same number of students picked Turtles and Fish as their favorite pet.
b. Total 7 students picked dogs as their favorite pet
c. 3 more students chose cats than turtles as their favorite pet
Question 3.
Use the tally chart in Problem 1 to complete the picture graph below.
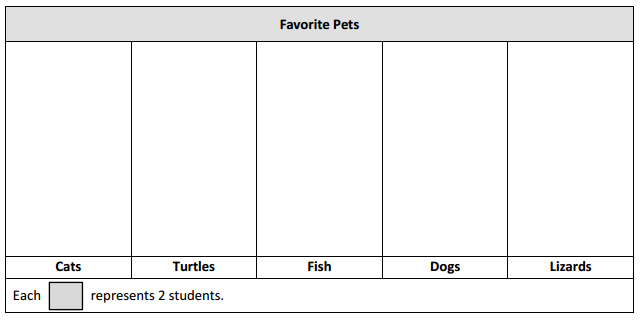
a. What does each ![]() represent?
represent?
b. How many students does ![]() represent? Write a number sentence to show how you know.
represent? Write a number sentence to show how you know.
c. How many more ![]() did you draw for dogs than for fish? Write a number sentence to show how many more students chose dogs than fish.
did you draw for dogs than for fish? Write a number sentence to show how many more students chose dogs than fish.
Answer:
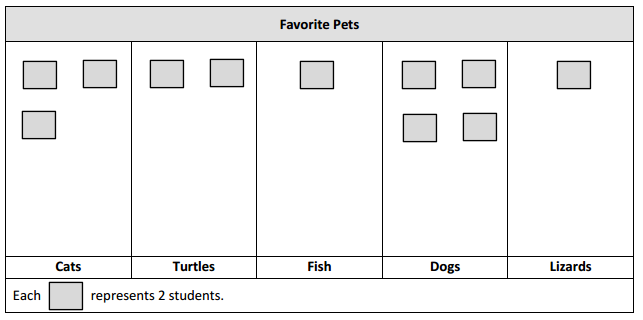
a. Each ![]() represent 2 students
represent 2 students
b. 10 students does ![]() represent. number sentence to show how we know is
represent. number sentence to show how we know is
there area 5 ![]() each box represents 2 students so 5 × 2 we get 10 students
each box represents 2 students so 5 × 2 we get 10 students
c. 3 more did we draw for dogs than for fish. The number sentence to show how many more students chose dogs than fish.
is there is 2 fish and 8 dogs were chosen by the students