Engage NY Eureka Math Algebra 2 Module 4 Lesson 25 Answer Key
Eureka Math Algebra 2 Module 4 Lesson 25 Exercise Answer Key
Opening Exercise:
a. Explain in writing what you learned about randomly divided groups from the last lesson. Share your thoughts with a neighbor.
Answer:
In the previous lesson, I saw that when a single group of observations with any variability is randomly divided into two groups, the means of these two groups will tend to differ just by chance. In some cases, the difference in the means of these two groups may be very small (or 0), but in other cases, this difference may be quite large.
b. How could simulation be used to understand the typical differences between randomized groups?
Answer:
Through simulation, you can learn about the values of the difference that would be expected just by chance. You can then use this information to decide if a given set of data from an experiment supports a claim of a statistically significant difference between two treatment means.
Exercises 1 – 3: Random Assignments and Computing the Difference of the Group Means
Imagine that 10 tomatoes of varying shapes and sizes have been placed in front of you. These 10 tomatoes (all of the same variety) have been part of a nutrient experiment where the application of the nutrient is expected to yield larger tomatoes that weigh more.
All 10 tomatoes have been grown under similar conditions regarding soil, water, and sunlight, but 5 of the tomatoes received the additional nutrient supplement. Using the weight data of these 10 tomatoes, you wish to examine the claim that the nutrient yields larger tomatoes on average.
Exercise 1.
Why would it be important in this experiment for the 10 tomatoes to all be of the same variety and grown under the same conditions (except for the treatment applied to 5 of the tomatoes)?
Answer:
Our variable is the weight of the tomatoes, and our objective is to see if the nutrient treatment yields heavier tomatoes. We do not want any other factors in our experiment that might cause some tomatoes to grow better than others; their presence might distort our findings. So, we prefer that the tomatoes all have similar growing conditions such as the same soil, the same amount of water, and the same amount of sunlight.
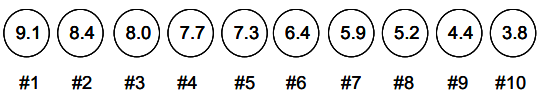
Note: When data collected from an experiment is examined, it is assumed that the experiment was conducted in a reasonable way with respect to important experimental design principles such as proper control measures. In most cases, if these principles are not incorporated, inaccurate conclusions may be reached. Here are the 10 tomatoes with their weights shown. They have been ordered from largest to smallest based on weight.
Here are the 10 tomatoes with their weight shown. They have been ordered from largest to smallest based on weight.
For now, do not be concerned about which tomatoes received the additional nutrients. The object here is to randomly assign the tomatoes to two groups.
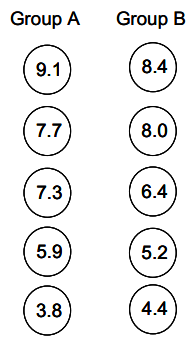
Imagine that someone assisting you uses a random number generator or some other impartial selection device and randomly selects tomatoes 1, 4, 5, 7, and 10 to be in Group A. By default, tomatoes 2, 3, 6, 8, and 9 will be in Group B. The result is illustrated below.
Exercise 2.
Confirm that the mean for Group A is 6. 76 ounces, and calculate the mean for Group B.
Answer:
The mean for Group B is 6.48 ounces.
Exercise 3.
Calculate the difference between the mean of Group A and the mean of Group B (that Is, calculate 1Å
Answer:
\(\overline{\boldsymbol{x}}_{A}\) – \(\overline{\boldsymbol{x}}_{B}\) = 6.76 – 6.48 = 0.28
The difference between the means of Group A and Group B is 0.28 ounces.
Exercises 4 – 6: Interpreting the Value of a Difference
The statistic of interest that you care about is the difference between the mean of the 5 tomatoes in Group A and the mean of the 5 tomatoes in Group B. For now, call that difference Diff. Dill = \(\overline{\boldsymbol{x}}_{A}\) – \(\overline{\boldsymbol{x}}_{B}\)
Exercise 4.
Explain what a Diff value of 1. 64 ounces would mean in terms of which group has the larger mean weight and the number of ounces by which that group’s mean weight exceeds the other group’s mean weight.
Answer:
Group A has a mean weight that is 1.64 ounces higher than Group B’s mean weight.
Exercise 5.
Explain what a Diff value of -0.4 ounces would mean in terms of which group has the larger mean weight and the number of ounces by which that group’s mean weight exceeds the other group’s mean weight.
Answer:
Group A has a mean weight that is 0.4 ounce lower than Group B’s mean weight.
Exercise 6.
Explain what a Diff value of 0 ounces would mean regarding the difference between the mean weight of the 5 tomatoes in Group A and the mean weight of the 5 tomatoes in Group B.
Answer:
Group A’s mean weight is the same as Group B’s mean weight.
Exercises 7 – 8: Additional Random Assignments
Exercise 7.
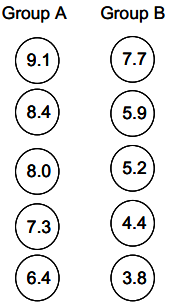
Below is a second random assignment of the 10 tomatoes to two groups. Calculate the mean of each group, and then calculate the Dill value for this second case. Also, interpret the Duff value in context using your responses to the previous questions as a guide.
Answer:
Group A has a mean weight of 7.84 ounces, and that is 2.44 ounces higher than Group B’s mean weight (5.4 ounces).
Exercise 8.
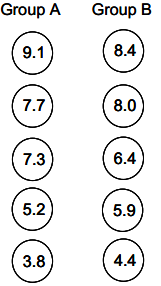
Here is a third random assignment of the 10 tomatoes. Calculate the mean of each group, and then calculate the value of Dill for this case. Interpret the Dill value in context using your responses to the previous questions as a guide.
Answer:
There is no difference between Group A’s mean weight and Group B’s mean weight; each mean is 6.62 ounces.
Eureka Math Algebra 2 Module 4 Lesson 25 Problem Set Answer Key
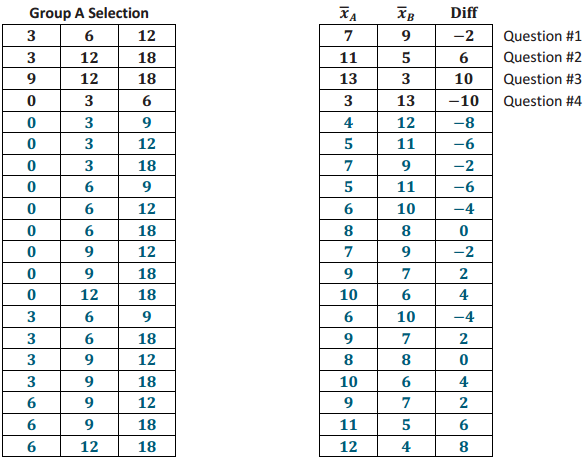
Six ping-pong balls are labeled as follows: 0, 3, 6, 9, 12, 18. Three ping-pong balls will be randomly assigned to Group A; the rest will be assigned to Group B. Diff = \(\overline{\boldsymbol{x}}_{A}\) – \(\overline{\boldsymbol{x}}_{B}\)
In the Exit Ticket problem, 4 of the 20 possible randomizations have been addressed.
Question 1.
Develop the remaining 16 possible random assignments to two groups, and calculate the Diff value for each.
(Note: Avoid redundant cases; selecting 0, 3, and 6 for Group A is not a distinct random assignment from selecting 6, 0, and 3, so do not record both.)
Answer:
Note: Reference notes on the far right of the table below refer to the corresponding question in the Exit Ticket.
Question 2.
Create a dot plot that shows the 20 Diff values obtained from the 20 possible randomizations. By visual inspection, what is the mean and median value of the distribution?
Answer:
The mean and median appear to be 0 due to the center and symmetry.
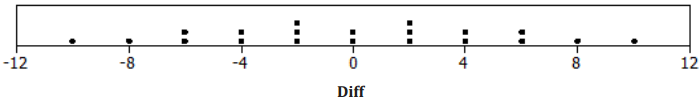
Question 3.
Based on your dot plot, what is the probability of obtaining a Diff value of 8 or higher?
Answer:
Two of the 20 values are 8 or higher.
\(\frac{2}{20}\) = 0.10 = 10%
Question 4.
Would a Diff value of 8 or higher be considered a difference that is likely to happen or one that is unlikely to happen? Explain.
Answer:
A Diffvalue 0f 8 or higher would be considered unlikely to happen since a difference this large would happen only 10% of the time.
Question 5.
Based on your dot plot, what is the probability of obtaining a Diff value of -2 or smaller?
Answer:
Nine of the 20 values are -2 or smaller.
\(\frac{9}{20}\) = 0.45 = 45%
Question 6.
Would a Diff value of -2 or smaller be considered a difference that is likely to happen or one that unlikely to happen? Explain.
Answer:
A Diff value of -2 or smaller would be considered likely to happen since a difference this small would happen 45% of the time.
Eureka Math Algebra 2 Module 4 Lesson 25 Exit Ticket Answer Key
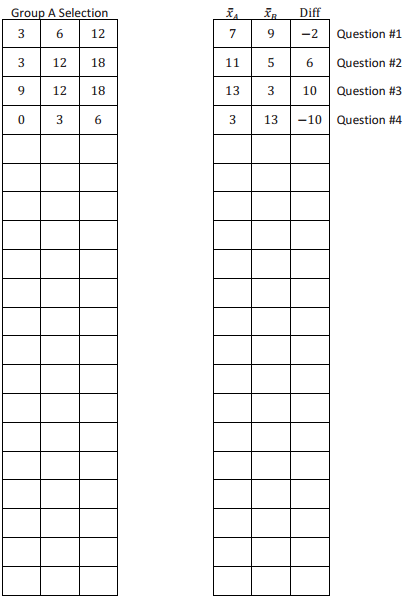
Six ping-pong balls are labeled as follows: 0, 3, 6, 9, 12, 18. Three ping-pong balls will be randomly assigned to Group A; the rest will be assigned to Group B. Diff = \(\overline{\boldsymbol{x}}_{A}\) – \(\overline{\boldsymbol{x}}_{B}\)
Question 1.
Calculate Diff, the difference between the mean of the numbers, on the balls assigned to Group A and the mean of
the numbers on the balls assigned to Group B (i.e., \(\overline{\boldsymbol{x}}_{A}\) – \(\overline{\boldsymbol{x}}_{B}\)) when the 3 ping-pong balls selected for Group A are 3, 6, and 12.
Answer:
7 – 9 = -2
Question 2.
Calculate Diff, the difference between the mean of the numbers, on the balls assigned to Group A and the mean of the numbers on the balls assigned to Group B (i.e., \(\overline{\boldsymbol{x}}_{A}\) – \(\overline{\boldsymbol{x}}_{B}\)) when the 3 ping-pong balls selected for Group A are 3, 12, and 18.
Answer:
11 – 5 = 6
Question 3.
What is the greatest possible value of Diff, and what selection of ping-pong balls for Group A corresponds to that value?
Answer:
If 9, 12, and 18 (the three highest numbers) are selected for Group A, Diff = 13 – 3 = 10.
Question 4.
What is the smallest (most negative) possible value of Duff and what selection of ping-pong balls for Group A corresponds to that value?
Answer:
If 0, 3, and 6 (the three lowest numbers) are selected 98 for Group A, Diff = 3 – 13 = -10.
Question 5.
If these 6 observations represent the bum times of 6 candles (in minutes), explain what a Duff value of 6 means in terms of (a) which group (A or B) has the longer average bum time and (b) the amount of time by which that group’s mean exceeds the other group’s mean.
Answer:
Group A has a mean burn time that is 6 minutes higher (longer) than Group B’s mean burn time.