Engage NY Eureka Math Algebra 2 Module 2 Lesson 8 Answer Key
Eureka Math Algebra 2 Module 2 Lesson 8 Problem Set Answer Key
Question 1.
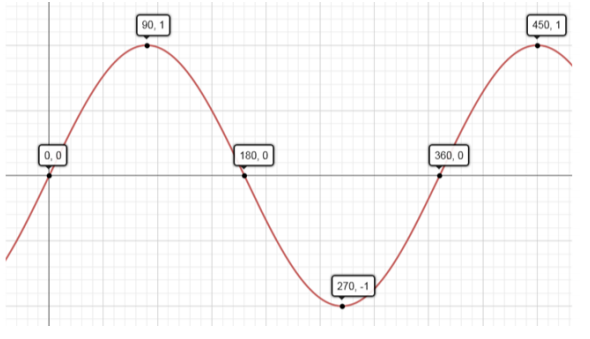
Graph the sine function on the Interval [- 360, 360] showing all key points of the graph (horizontal and vertical intercepts and maximum and minimum points). Then, use the graph to answer each of the following questions.
a. On the interval [- 360,360], what are the relative minima of the sine function? Why?
Answer:
The sine function has relative minima at – 90 and 270 because when rotated by -90° or 270°, the initial ray intersects the unit circle at the bottom of the circle; therefore, the sine is at its smallest possible value.
b. On the interval [-360, 360], what are the relative maxima of the sine function? Why?
Answer:
The sine function has relative maxima at -270 and 90 because when rotated by -270° or 90°, the initial ray intersects the unit circle at the top of the circle; therefore, the sine is at its largest possible value.
c. On the interval [-360, 360], for what values of θ is sin(θ°) = 0? Why?
Answer:
The sine function has a value of 0 at -360, -180, 0, 180, and 360 because when rotated by any of these degree measurements, the initial ray intersects the unit circle at a point on the x-axis; therefore, sin(θ°), which measures the height of the point on the circle, is equal to 0.
d. If we continued to extend the graph in either direction, what would it look like? Why?
Answer:
It would repeat the same pattern on intervals of length 360 in either direction. So, from 360 to 720, the graph would look exactly like it does from 0 to 360, as it also would from 720 to 1080, and so on. Also, from -360 to 0, the graph would look the same as it does from 0 to 360, as it also would from -720 to -360, and so on.
e. Arrange the following values in order from smallest to largest by using their location on the graph.
Answer:
sin(170°) sin(85°) sin(-85°) sin(200°)
Answer:
sin(-85°) sin(200°) sin(170°) sin(85°)
f. On the interval (90, 270), is the graph of the sine function increasing or decreasing? Based on that, name another interval not included in (90, 270) where the sine function must have the same behavior.
Answer:
Decreasing; (450, 630)
Question 2.
Graph the cosine function on the interval [-360, 360] showing all key points of the graph (horizontal and vertical intercepts and maximum and minimum points). Then, use the graph to answer each of the following questions.
a. On the interval [-360, 360], what are the relative minima of the cosine function? Why?
Answer:
For the cosine function, a relative minimum of -1 occurs at -180 and 180 because when rotated by -180° or 180°, the initial ray Intersects the unit circle at the leftmost point of the circle; therefore, the cosine is at its smallest possible value.
b. On the interval [-360, 360], what are the relative maxima of the cosine function? Why?
Answer:
For the cosine function, a relative maximum of 1 occurs at -360, 0, and 360 because when rotated by -360°, 0°, or 3 60°, the initial ray intersects the unit circle at the rightmost point of the circle; therefore, the cosine is at its largest possible value.
c. On the interval [- 360, 360], for what values of θ is cos(θ°) = 0? Why?
Answer:
The cosine function has a value of 0 at – 270, – 90, 90, and 270 because when rotated by any of these degree measurements, the initial ray intersects the unit circle at a point on the y-axis; therefore, cos(θ°), which measures the horizontal position of the point on the circle, is equal to 0.
d. If we continued to extend the graph in either direction, what would it look like? Why?
Answer:
It would repeat the same pattern on intervals of length 360 in either direction. So from 360 to 720, the graph would look exactly like it does from 0 to 360, as it also would from 720 to 1080, and so on. Also, from -360 to 0, the graph would look the same as it does from 0 to 360, as it also would from -720 to -360, and so on.
e. What can be said about the end behavior of the cosine function?
Answer:
Like the sine function, the cosine function continues to oscillate between the values of -1 and 1 as θ approaches ∞ or -∞.
f. Arrange the following values in order from smallest to largest by using their location on the graph.
cos(135°) cos(85°) cos(-15°) cos(190°)
Answer:
cos(190°) cos(135°) cos(85°) cos(-15°)
Question 3.
Write a paragraph comparing and contrasting the sine and cosine functions using their graphs and end behavior.
Answer:
The graphs of sine and cosine have the same domain, range, amplitude, and period. Neither graph has end behavior because both oscillate between the values of -1 and 1 as θ approaches ∞ or -∞. The graphs have different y-intercepts (starting points) because at 0° sine is 0 and cosine is 1. When sine is at its maximum or minimum, the cosine function is 0 and has a horizontal intercept. The graphs are horizontal translations of each other, so the graph of cosine can be made to look like sine by using a horizontal shift and vice versa.
Question 4.
Use the graph of the sine function given below to answer the following questions.
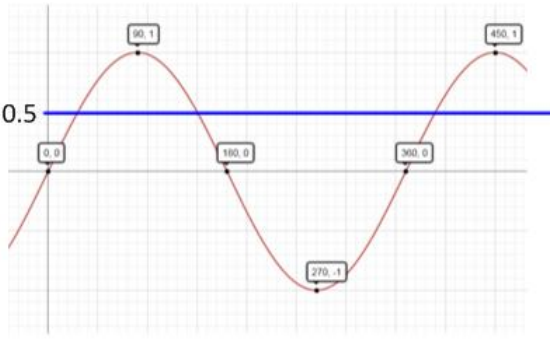
a. Desmond is trying to determine the value of sin(45°). He decides that since 45 is halfway between 0 and 90, sin(45°) = \(\frac{1}{2}\). Use the graph to show him that he is incorrect.
Answer:
Using the graph, the y-value at θ = 45 is above 0.5, so sin(45°) > \(\frac{1}{2}\). That is, the graph is not linear between the point (0, 0) and the point (90, 1).
b. Using the graph, complete each statement by filling in the symbol >, <, or =.
i. sin(250°) _________ sin(290°)
ii. sin(25°) _________ sin(85°)
iii. sin(140°) _________ sin(160°)
Answer:
i. sin(250°) = sin(290°)
ii. sin(25°) < sin(85°)
iii. sin(140°) > sin(160°)
c. On the interval [0, 45°], list the values of θ such that sin(θ°) = \(\frac{1}{2}\).
Answer:
30, 150, 390
d. Explain why there are no values of θ such that sin(θ°) = 2.
Answer:
The sine function ranges in value from – 1 to 1. Since the maximum value of the sine function is 1 (when the terminal ray of the rotation intersects the top of the circle), it is impossible for there to be a value θ such that sin(θ°) = 2.
Eureka Math Algebra 2 Module 2 Lesson 8 Exit Ticket Answer Key
Question 1.
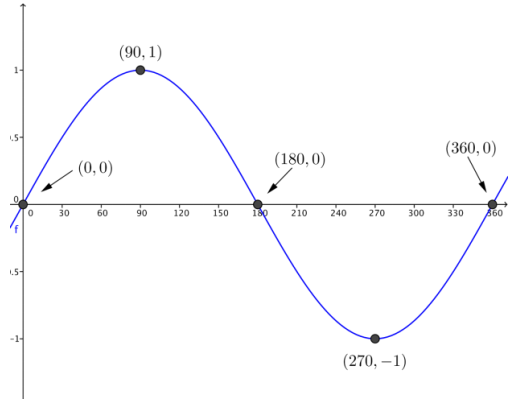
Sketch a graph of the sine function on the interval [0, 360] showing all key points of the graph (horizontal and vertical intercepts and maximum and minimum points). Mark the coordinates of the maximum and minimum points and the intercepts.
Answer:
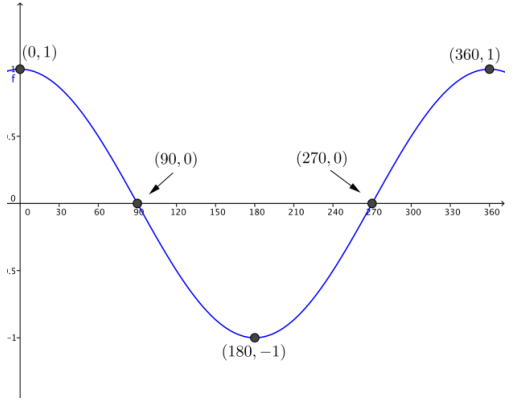
Question 2.
Sketch a graph of the cosine function on the interval [0, 360] showing all key points of the graph (horizontal and vertical intercepts and maximum and minimum points). Mark the coordinates of the maximum and minimum points and the intercepts.
Answer:
Eureka Math Algebra 2 Module 2 Lesson 8 Exploratory Challenge Answer Key
Exploratory Challenge 1
Your group will be graphing: f(θ) = sin(θ°) g(θ) = cos(θ°)
The circle on the handout is a unit circle, meaning that the length of the radius is one unit.
Question 1.
Mark axes on the poster board, with a horizontal axis in the middle of the board and a vertical axis near the left edge, as shown.
Answer:
Question 2.
Measure the radius of the circle using a ruler. Use the length of the radius to mark 1 and – 1 on the vertical axis.
Answer:
Question 3.
Wrap the yarn around the circumference of the circle starting at 0. Mark each 15° increment on the yarn with the marker. Unwind the yarn and lay it on the horizontal axis. Transfer the marks on the yarn to corresponding increments on the horizontal axis. Label these marks as 0, 15, 30, …, 360.
Answer:
Question 4.
Record the number of degrees of rotation θ on the horizontal axis of the graph, and record the value of either sin(θ°) or cos(θ°) on the vertical axis. Notice that the scale is wildly different on the vertical and horizontal axes.
Answer:
Question 5.
If you are graphing g(θ) = cos(θ°): For each θ marked on your horizontal axis, beginning at 0, use the spaghetti to measure the horizontal displacement from the vertical axis to the relevant point on the unit circle. The horizontal displacement is the value of the cosine function. Break the spaghetti to mark the correct length, and place it vertically at the appropriate tick mark on the horizontal axis.
Answer:
Question 6.
If you are graphing f(θ) = sin(θ°): For each θ marked on your horizontal axis, beginning at 0, use the spaghetti to measure the vertical displacement from the horizontal to the relevant point on the unit circle. The vertical displacement is the value of the sine function. Break the spaghetti to mark the correct length, and place it vertically at the appropriate tick mark on the horizontal axis.
Answer:
Question 7.
Remember to place the spaghetti below the horizontal axis when the value of the sine function or the cosine function is negative. Glue each piece of spaghetti in place.
Answer:
Question 8.
Draw a smooth curve that connects the points at the end of each piece of spaghetti.
Answer:
Exploratory Challenge 2
Part I: Consider the function f(θ) = sin(θ°).
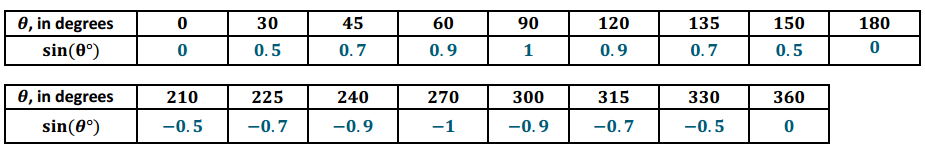
a. Complete the following table by using the special values learned in Lesson 4. Give values as approximations to one decimal place.
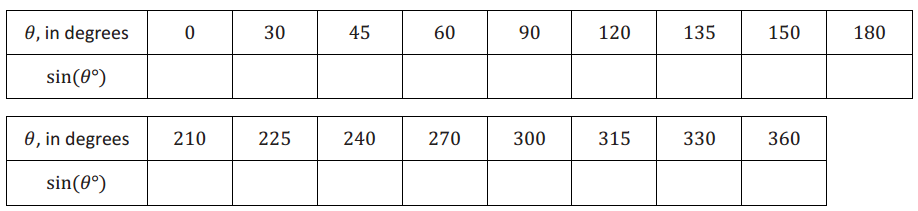
Answer:
b. Using the values in the table, sketch the graph of the sine function on the interval [0,360].
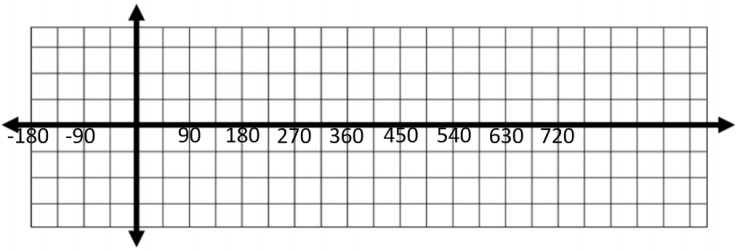
Answer:
c. Extend the graph of the sine function above so that it is graphed on the interval from [-180,720].
Answer:
d. For the interval [-180, 720], describe the values of θ at which the sine function has relative maxima and minima.
Answer:
Relative maxima occur at 90 and 450. Relative minima occur at -90, 270, and 630
e. For the interval [-180, 720], describe the values of O for which the sine function is increasing and decreasing.
Answer:
Increasing: -90 < θ < 90, 270 < θ < 450, and 630 < θ < 720
Decreasing: -180 < θ < – 90, 90 < θ < 270, and 450 < θ < 630
f. For the interval [-180, 720], list the values of θ at which the graph of the sine function crosses the horizontal axis.
Answer:
-180, 0, 180, 360, 540, 720
g. Describe the end behavior of the sine function.
Answer:
The sine function will continue to oscillate between -1 and 1 as θ → ∞ or θ → -∞.
h. Based on the graph, is sine an odd function, even function, or neither? How do you know?
Answer:
Sine is an odd function because the graph is symmetric with respect to the origin.
i. Describe how the sine function repeats.
Answer:
The sine function repeats the same pattern on every interval of length 360 because 360° is one full turn. After that, the values of sine just continue to repeat.
Part II: Consider the function g(θ) = cos(θ°).
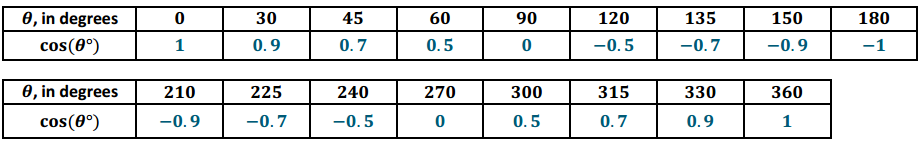
a. Complete the following table giving answers as approximations to one decimal place.
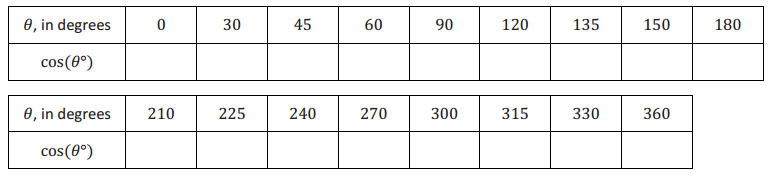
Answer:
b. Using the values in the table, sketch the graph of the cosine function on the interval [0,360].
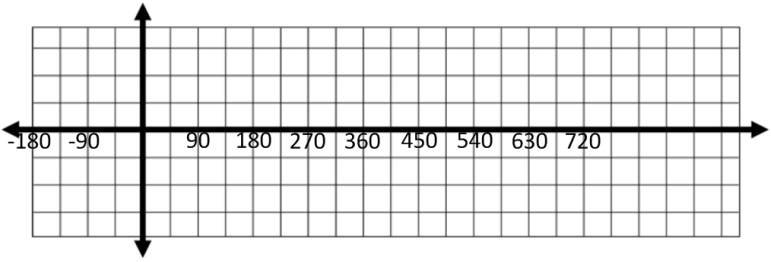
Answer:
c. Extend the graph of the cosine function above so that it is graphed on the interval from [-180, 720].
Answer:
d. For the interval [-180, 720], describe the values of θ at which the cosine function has relative maxima and minima.
Answer:
Maxima occur at 0,360,720.
Minima occur at -180,180,540.
e. For the interval [-180,720], describe the values of θ for which the cosine function is increasing and decreasing.
Answer:
Increasing: -180 < θ < 0,180 < θ < 360, and 540 < θ < 720
Decreasing: 0 < θ < 180 and 360 < θ <540
f. For the interval [- 180, 720], list the values of θ at which the graph of the cosine function crosses the horizontal axis.
Answer:
– 90, 90, 270, 450, 630
g. Describe the end behavior of the graph of the cosine function.
Answer:
The cosine function will continue to oscillate between -1 and 1 as θ → ∞ or θ → b -∞.
h. Based on the graph, Is cosine an odd function, even function, or neither? How do you know?
Answer:
Cosine is an even function because the graph is symmetric with respect to the vertical axis.
i. Describe how the cosine function repeats.
Answer:
The cosine function repeats the same pattern on intervals of length 360 because 360° is one full turn. After that, the values of cosine just continue to repeat.
j. How are the sine function and cosine function related to each other?
Answer:
The two functions are horizontal translations of each other. We could shift the graph of either function horizontally to line up with the graph of the other function.