Engage NY Eureka Math Algebra 2 Module 2 Lesson 12 Answer Key
Eureka Math Algebra 2 Module 2 Lesson 12 Opening Example Answer Key
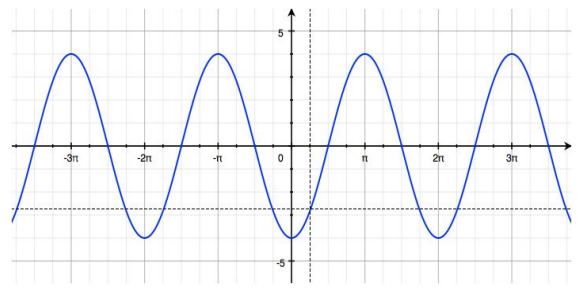
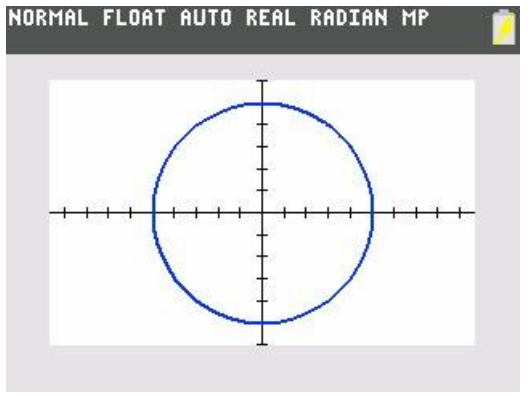
Ernesto thinks that this is the graph of f(x) = 4 sin (x – \(\frac{\pi}{2}\)) Danielle thinks it is the graph of f(x) = 4cos(x). Who is correct and why?
Answer:
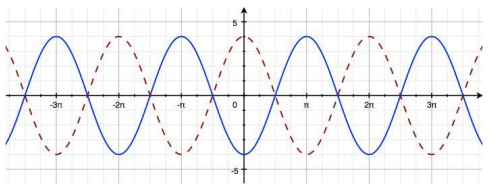
Ernesto is correct. For the function y = A sin(ω(x – h)) + k, Ernesto’s solution would have A = 4, ω = 1, h = \(\frac{\pi}{2}\), and k = 0. The graph shown has an amplitude of 4 and a period of 2π; compared to the graph of the sine function, this graph is not translated vertically, making k = 0. This graph is a horizontal translation of the graph of the sine function to the right \(\frac{\pi}{2}\) units. Meanwhile, for y = A cos(ω(x – h)) + k, Danielle’s solution would have A = 4, ω = 1, h = 0, and k = 0; however, the function f(x) = 4 cos(x) has a maximum point at (0, 4), and this graph has a minimum point when x = 0. To be correct, Danielle’s function would have to be f(x) = – 4 cos(x). The dotted graph below is the graph of f(x) = 4cos(x).
Eureka Math Algebra 2 Module 2 Lesson 12 Exploratory Challenge/Exercise Answer Key
Exploratory Challenge/Exercises 1 – 5
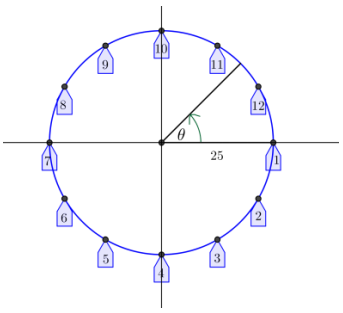
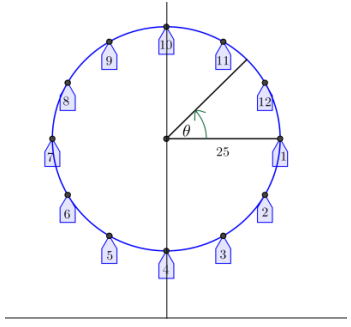
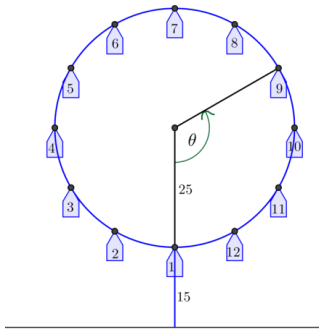
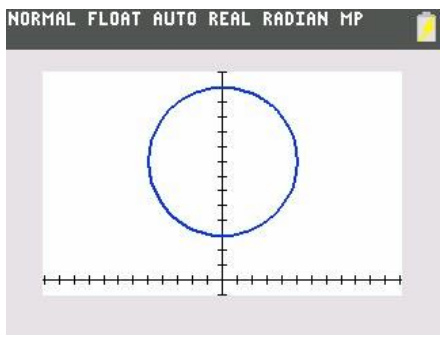
A carnival has a Ferris wheel that is 50 feet in diameter with 12 passenger cars. When viewed from the side where passengers board, the Ferris wheel rotates counterclockwise and makes two full turns each minute. Riders board the Ferris wheel from a platform that is 15 feet above the ground. We will use what we have learned about periodic functions to model the position of the passenger cars from different mathematical perspectives. We will use the points on the circle in the diagram on the right to represent the position of the cars on the wheel.
Exercise 1.
For this exercise, we will consider the height of a passenger car to be the vertical displacement from the horizontal line through the center of the wheel and the co-height of a passenger car to be the horizontal displacement from the vertical line through the center of the wheel.
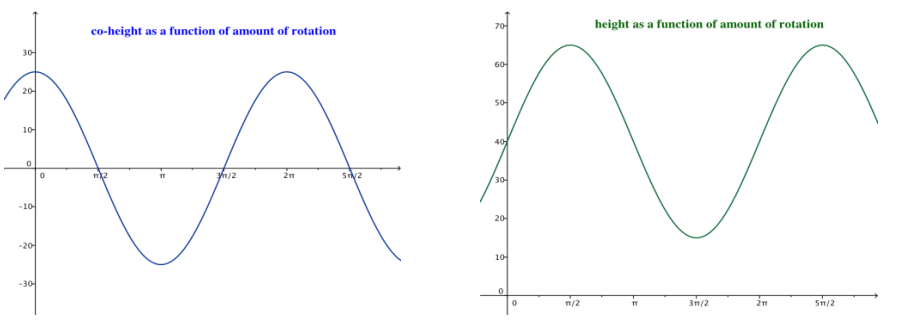
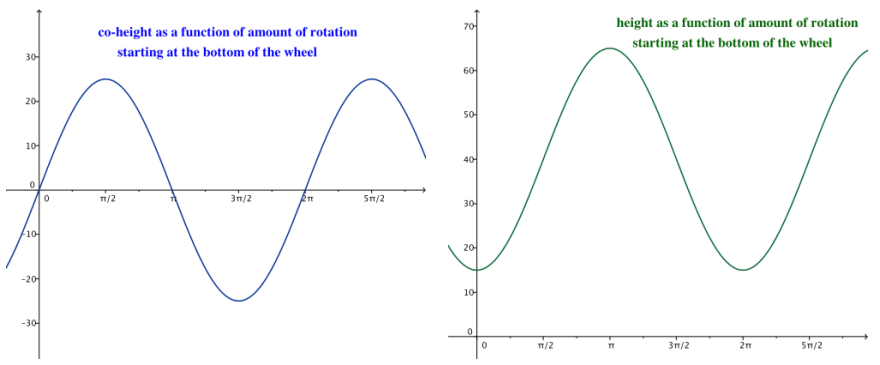
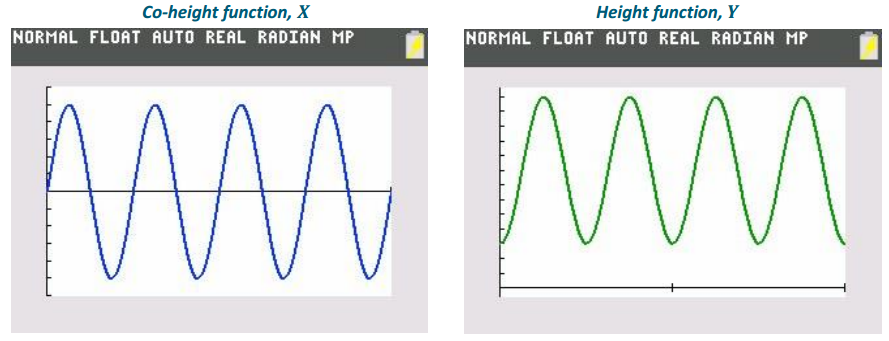
a. Let θ = 0 represent the position of car 1 in the diagram above. Sketch the graphs of the co-height and the height of car 1 as functions of θ, the number of radians through which the car has rotated.
Answer:
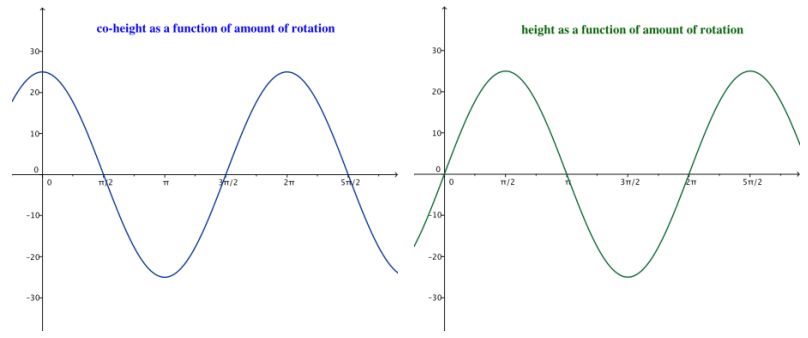
b. What is the amplitude, |A|, of the height and co-height functions for this Ferris wheel?
Answer:
|A| = 25
c. Let X(θ) represent the co-height function after rotation by θ radians, and let Y(θ) represent the height function after rotation by θ radians. Write functions X for the co-height and Y for the height in terms of θ.
Answer:
X(θ) = 25 cos(θ)
Y(θ) = 25 sin(θ)
d. Graph the functions X and Y from part (c) on a graphing calculator set to parametric mode. Use a viewing window [-48,48] × [-30,30]. Sketch the graph below.
Answer:
e. Why did we choose the symbols X and Y to represent the co-height and height functions?
Answer:
The co-height function measures the horizontal position of the passenger car that we typically name x. The height function measures the vertical position of the passenger car that we typically name y. It makes sense to use X as the name of the function that describes horizontal movement and Y as the name of the function that describes vertical movement.
f. Evaluate X(0) and Y(0), and explain their meaning in the context of the Ferris wheel.
Answer:
Using the equations from part (c), X(0) = 25 cos(0) = 25, and Y(0) = 25 sin(0) = 0. Thus, when the wheel has not yet rotated (that is, rotated through 0 radians), the co-height of the car is 25, and the height is 0. This means that the car is at the 3 o’clock position.
g. Evaluate X \(\left(\frac{\pi}{2}\right)\) and Y \(\left(\frac{\pi}{2}\right)\), and explain their meaning in the context of the Ferris wheel.
Answer:
Using the equations from part (c), X \(\left(\frac{\pi}{2}\right)\) = 25 cos \(\left(\frac{\pi}{2}\right)\) = 0, and Y \(\left(\frac{\pi}{2}\right)\) = 25 sin \(\left(\frac{\pi}{2}\right)\) = 25. Thus, when the wheel has rotated through \(\frac{\pi}{2}\) radians (that is, rotated through a quarter turn), the co-height of the car is 0, and the height is 25. This means that the car is at the top of the wheel.
Exercise 2.
The model we created in Exercise 1 measures the height of car 1 above the horizontal line through the center of the wheel. We now want to alter this model so that it measures the height of car 1 above the ground.
a. If we measure the height of car 1 above the ground instead of above the horizontal line through the center of the wheel, how will the functions X and Y need to change?
Answer:
The co-height function X will not change, but the height function Y will need to have a constant added to it since car 1 starts 40 feet above the ground.
b. Let θ = 0 represent the position of car 1 in the diagram to the right. Sketch the graphs of the co-height and the height of car 1 as functions of the number of radians through which the car has rotated, θ.
Answer:
c. How are the graphs from part (b) related to the graphs from Exercise 1(a)?
Answer:
The co-height graphs are the same. The height graph from part (b) is the height graph from Exercise 1(a) translated 40 units upward.
d. From this perspective, find the equations for the functions X and Y that model the position of car 1 with respect to the number of radians the car has rotated.
Answer:
X(θ) = 25 cos(θ)
Y(θ) = 25 sin(θ) + 40
Change the viewing window on your calculator to [- 60, 60] × [- 5, 70], and graph the functions X and Y together. Sketch the graph.
Answer:
e. Evaluate X(0) and Y(0), and explain their meaning in the context of the Ferris wheel.
Answer:
Using the equations from part (c), X(0) = 25cos(0) = 25, and Y(0) = 25sin(0) + 40 = 40. Thus, when the wheel has not yet rotated (that is, rotated through 0 radians), the co-height of the car is 25, and the height is 40. This means that the car is at the 3 o’clock position.
f. Evaluate X\(\left(\frac{\pi}{2}\right)\) and Y \(\left(\frac{\pi}{2}\right)\), and explain their meaning in the context of the Ferris wheel.
Answer:
Using the equations from part (c), X \(\left(\frac{\pi}{2}\right)\) = 25cos \(\left(\frac{\pi}{2}\right)\) = 0, and Y\(\left(\frac{\pi}{2}\right)\) = 25sin \(\left(\frac{\pi}{2}\right)\) + 40 = 65. Thus, when the wheel has rotated through \(\frac{\pi}{2}\) radians (that is, rotated through a quarter turn), the co-height of the car is 0, and the height is 65. This means that the car is at the top of the wheel.
Exercise 3.
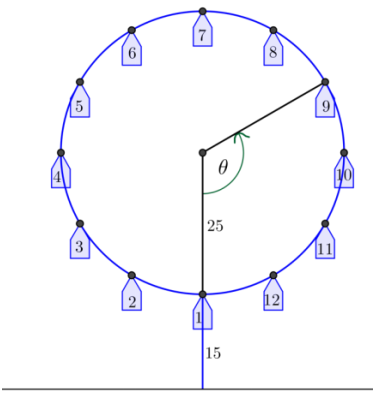
In reality, no one boards a Ferris wheel halfway up; passengers board at the bottom of the wheel. To truly model the motion of a Ferris wheel, we need to start with passengers on the bottom of the wheel. Refer to the diagram below.
a. Let θ = 0 represent the position of car 1 at the bottom of the wheel in the diagram above. Sketch the graphs of the height and the co-height of car 1 as functions of θ, the number of radians through which the car has rotated from the position at the bottom of the wheel.
Answer:
b. How are the graphs from part (a) related to the graphs from Exercise 2(b)?
Answer:
The graphs from part (a) are the graphs from Exercise 2(b) translated horizontally \(\frac{\pi}{2}\) units to the right.
c. From this perspective, find the equations for the functions X and Y that model the position of car 1 with respect to the number of radians the car has rotated.
Answer:
X(θ) = 25 cos(θ – \(\frac{\pi}{2}\))
Y(θ) = 25 sin (θ – \(\frac{\pi}{2}\)) + 40
d. Graph the functions X and Y from part (c) together on the graphing calculator. Sketch the graph. How is this graph different from the one from Exercise 2(e)?
Answer:
Although the finished graph looks exactly like the graph from Exercise 2(e), this one starts drawing from the bottom of the circle, as opposed to drawing from the 3 o’clock position.

e. Evaluate X(0) and Y(0), and explain their meaning in the context of the Ferris wheel.
Answer:
Using the equations from part (c), X(0) = 25 cos (0 – \(\frac{\pi}{2}\)) = 0, and Y(0) = 25 sin (0 – \(\frac{\pi}{2}\)) + 40 = 15.
Thus, when the wheel has not yet rotated (that is, rotated through 0 radians), the co-height of the car is 0, and the height is 15. This means that the car is at the bottom of the wheel.
f. Evaluate X \(\left(\frac{\pi}{2}\right)\) and Y\(\left(\frac{\pi}{2}\right)\), and explain their meaning in the context of the Ferris wheel.
Answer:
Using the equations from part(c), X\(\left(\frac{\pi}{2}\right)\) = 25cos\(\left(\frac{\pi}{2}-\frac{\pi}{2}\right)\) = 25, and Y\(\left(\frac{\pi}{2}\right)\) = 25 sin\(\left(\frac{\pi}{2}-\frac{\pi}{2}\right)\) + 40 = 40. Thus, when the wheel has rotated through \(\frac{\pi}{2}\) radians (that is, rotated through a quarter turn), the co-height of the car is 25, and the height is 40. This means that the car is at the 3 o’clock position.
Exercise 4.
Finally, it is not very useful to track the position of a Ferris wheel as a function of how much it has rotated. It would make more sense to keep track of the Ferris wheel as a function of time. Recall that the Ferris wheel completes two full turns per minute.
a. Let θ = 0 represent the position of car 1 at the bottom of the wheel. Sketch the graphs of the co-height and the height of car 1 as functions of time.
Answer:
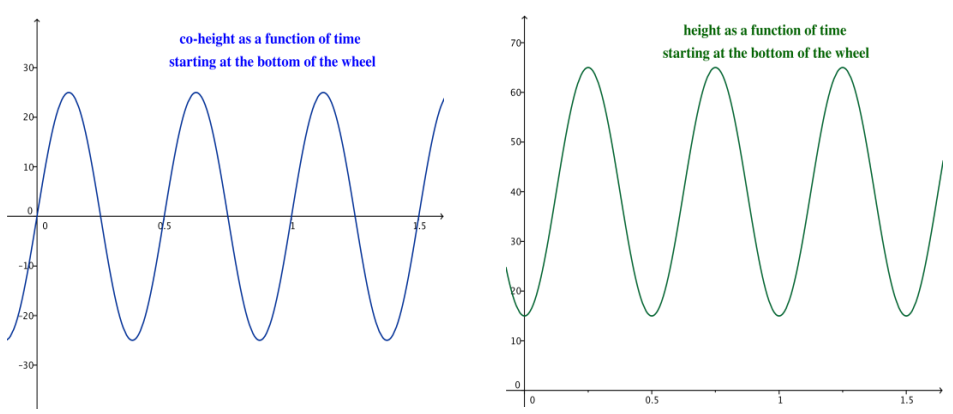
b. The co-height and height functions from part (a) can be written in the form X(t) = A cos(ω(t – h)) + k and Y(t) = A sin(ω(t – h)) + k. From the graphs in part (a), identify the values of A, ω, h, and k for each function X and Y.
Answer:
For the co-height function: A = 25, ω = 4π, h = \(\frac{1}{8}\), and k = 0.
For the height function: A = 25, ω = 4π, h = \(\frac{1}{8}\), and k = 40.
c. Write the equations X(t) and Y(t) using the values you identified in part (b).
Answer:
X(t) = 25 cos (4 (t – \(\frac{1}{8}\)))
Y(t) = 25 cos (4 (t – \(\frac{1}{8}\))) + 40
d. In function mode, graph your functions from part (c) on a graphing calculator for 0 < t < 2, and compare against your sketches in part (a) to confirm your equations.
Answer:
e. Explain the meaning of the parameters in your equation for X in terms of the Ferris wheel scenario.
Answer:
For the co-height function, we have A = 25, ω = 4π, h = \(\frac{1}{8}\), and k = 0.
→ The amplitude is A = 25, which means that the difference between the largest and smallest values of the co-height is 50 feet. This is the diameter of the wheel.
→ The period is P = \(\frac{2 \pi}{|\omega|}=\frac{1}{2}\), and the frequency is f = \(\frac{1}{P}\) = 2. This means that the wheel rotates twice each minute.
→ The phase shift is h = \(\frac{1}{8}\). Each quarter revolution takes \(\frac{1}{8}\) of a minute, which is 12.5 seconds. Without
this shift, our equations would start car 1 in the 3 o’clock position. We want to start it from the bottom of the wheel.
→ The equation of the midline is y = 0, which means that the co-height varies between – 25 and 25 feet.
f. Explain the meaning of the parameters in your equation for Y in terms of the Ferris wheel scenario.
Answer:
For the height function, we have A = 25, ω = 4π, h = \(\frac{1}{8}\) and k = 40.
→ The amplitude is A = 25, which means that the difference between the largest and smallest values of the co-height is 50 feet. This is the diameter of the wheel.
→ The period is P = \(\frac{2 \pi}{|\omega|}=\frac{1}{2^{\prime}}\) and the frequency is f = \(\frac{1}{P}\) = 2. This means that the wheel rotates twice each minute.
→ The phase shift is h = \(\frac{1}{8}\). Each quarter revolution takes \(\frac{1}{8}\) of a minute, which is 12.5 seconds. Without this shift, our equations would start car 1 in the 3 o’clock position. We want to start it from the bottom of the wheel.
→ The equation of the midline is y = 40, which means that the height varies between 15 and 65 feet.
Exercise 5.
In parametric mode, graph the functions X and Y from Exercise 3(c) on a graphing calculator for 0 ≤ t ≤ \(\frac{1}{2}\)
a. Sketch the graph. How is this graph different from the graph in Exercise 3(d)?
Answer:
Although the finished graphs look identical, the difference is that this graph has a different scale for the parameter t. Instead of needing 0 < θ < 2π to complete the circle, we only need to specify 0 < t < \(\frac{1}{2}\) since the wheel makes one complete turn in \(\frac{1}{2}\) minute.
b. What would the graph look like if you graphed the functions X and Y from Exercise 3(c) for 0 ≤ t ≤ \(\frac{1}{4}\) ? Why?
Answer:
If we graphed X and Y for 0 ≤ t ≤ \(\frac{1}{4}\) then the graph would only show the left half of the circle. This is because it takes \(\frac{1}{4}\) minute for the car to travel from the bottom of the circle to the top.
c. Evaluate X(0) and Y(0), and explain their meaning in the context of the Ferris wheel.
Answer:
Using the equations from part (c), X(0) = 25 cos (o – \(\frac{\pi}{2}\)) = 0, and Y(0) = 25 sin (o – \(\frac{\pi}{2}\)) + 40 = 15. Thus, when the wheel has not yet rotated (that is, rotated for 0 minutes), the co-height of the car is 0, and the height is 15. This means that the car is at the bottom of the wheel.
d. Evaluate X\(\left(\frac{1}{8}\right)\) and Y\(\left(\frac{1}{8}\right)\) and explain their meaning in the context of the Ferris wheel.
Answer:
Using the equations from part (c), X\(\left(\frac{1}{8}\right)\) = 25 cos \(\left(4 \pi\left(\frac{1}{8}\right)-\frac{\pi}{2}\right)\)= 25, and Y\(\left(\frac{1}{8}\right)\) = 25 sin \(\left(4 \pi\left(\frac{1}{8}\right)-\frac{\pi}{2}\right)\) + 40 = 40. Thus, when the wheel has rotated for \(\frac{1}{8}\) of a minute (that is, rotated through a quarter turn since the wheel rotates once every \(\frac{1}{2}\) minute), the co-height of the car is 25, and the height is 40. This means that the car is at the 3 o’clock position.
Exercise 6.
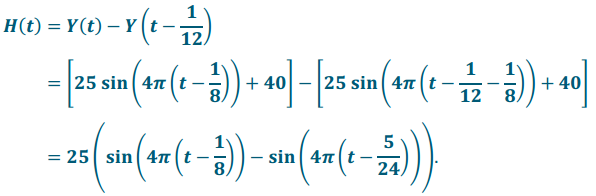
You are in car 1, and you see your best friend in car 3. How much higher than your friend are you when you reach the top?
Answer:
When you are at the top, your height is 65 feet, and you have rotated through 1800, which is π radians. At that time, your friend in car 3 has rotated through 60° less than you have, so car 3 has rotated through 120°, which is \(\frac{2 \pi}{3}\) radians. Using the height as a function of rotation from Exercise 3, we know that the height of car 3 is
You are 65 feet high, and your friend it 52.5 feet high; therefore, you are 12.5 feet higher than your friend in car 3.
Exercise 7.
Find an equation of the function H that represents the difference in height between you in car 1 and your friend in car 3 as the wheel rotates through θ radians, beginning with θ = 0 at the bottom of the wheel.
Answer:
The height of car 1 after rotation through θ radians is given by Y(θ). Since car 3 is \(\frac{\pi}{3}\) radians behind car 1, the height of car 3 after rotation through θ radians is given by Y (θ – \(\frac{\pi}{3}\)) Then, the height difference is given by the equation:
Exercise 8.
Find an equation of the function that represents the difference in height between car 1 and car 3 with respect to time, t, in minutes. Let t = 0 minutes correspond to a time when car 1 is located at the bottom of the Ferris wheel. Assume the wheel is moving at a constant speed starting at t = O.
Answer:
Car 3 is \(\frac{1}{6}\) of a turn behind car 1. Since it takes \(\frac{1}{2}\) minute to make one turn, car 3 is \(\frac{1}{6}\) . \(\frac{1}{2}\) = \(\frac{1}{12}\) of a minute behind car 1. Then, at time t, the position of carl is Y(t), and the position of car 3 is Y (t – \(\frac{1}{12}\)).
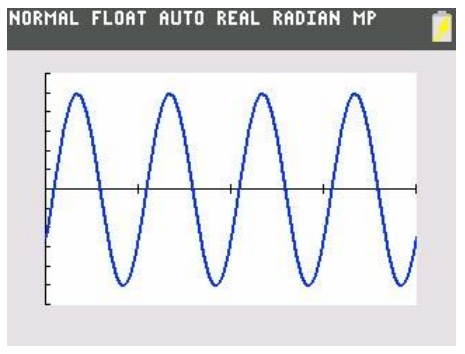
Exercise 9.
Use a calculator to graph the function H in Exercise 8 for 0 ≤ t ≤ 2. What type of function does this appear to be? Does that make sense?
Answer:
The function H appears to be a periodic sinusoidal function. It makes sense that it would be periodic because the distance between the two cars would be the same each time the wheel makes a complete turn. That is, every \(\frac{1}{2}\) minute, the distance between the cars repeats.
Eureka Math Algebra 2 Module 2 Lesson 12 Problem Set Answer Key
Question 1.
In the classic novel Don Quixote, the title character famously battles a windmill. In this problem, you will model what happens when Don Quixote battles a windmill, and the windmill wins. Suppose the center of the windmill is 20 feet off the ground, and the sails are 15 feet long. Don Quixote is caught on a tip of one of the sails. The sails are turning at a rate of one counterclockwise rotation every 60 seconds.
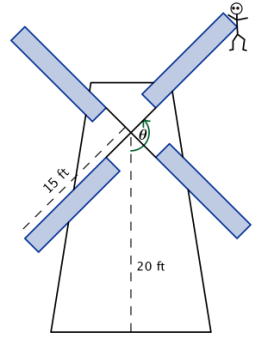
a. Explain why a sinusoidal function could be used to model Don Quixote’s height above the ground as a function of time.
Answer:
Since Don Quixote is moving around a circle, and the sine function measures vertical displacement of an object moving around a circle, we can use a sine function to track his position above and below the horizontal line through the center of the sails of the windmill. Using transformations, we can use this function to model the height of any point on any circle.
b. Sketch a graph of Don Quixote’s height above the ground as a function of time. Assume t = 0 corresponds to a time when he was closest to the ground. What are the amplitude, period, and midline of the graph?
Answer:
The amplitude is 15 feet; the period is \(\frac{2 \pi}{60}\) which is the same as \(\frac{\pi}{30}\); and the midline has equation y = 20.
c. Model Don Quixote’s height H above the ground as a function of time t since he was closest to the ground.
Answer:
The height of Don Quixote after t seconds is
H(t) = 15 sin (\(\frac{\pi}{30}\)(t – 15)) + 20.
d. After 1 minute and 40 seconds, Don Quixote fell off the sail and straight down to the ground. How far did he fall?
Answer:
He fell at t = 100 seconds. The vertical distance in feet that he fell is the following:
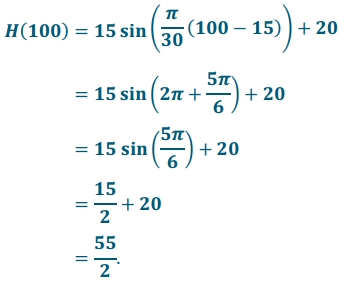
Therefore, H(100) = 27.5. Don Quixote fell 27.5 feet.
Question 2.
The High Roller, a Ferris wheel in Las Vegas, Nevada, opened in March 2014. The 550 ft. tall wheel has a diameter of 520 feet. A ride on one of its 28 passenger cars lasts 30 minutes, the time it takes the wheel to complete one full rotation. Riders board the passenger cars at the bottom of the wheel. Assume that once the wheel is in motion, it maintains a constant speed for the 30-minute ride and is rotating in a counterclockwise direction.
a. Sketch a graph of the height of a passenger car on the High Roller as a function of the time the ride began.
Answer:
b. Write a sinusoidal function H that represents the height of a passenger car t minutes after the ride begins.
Answer:
H(t) = 260 sin (\(\frac{2 \pi}{30}\)(t – 7.5)) + 280
c. Explain how the parameters of your sinusoidal function relate to the situation.
Answer:
The amplitude, 260, is the radius of the wheel. The period is 30 minutes, so ω = \(\frac{2 \pi}{30}\). The midline is y = 280, which represents how high the center of the wheel is above the ground. To make the graph have a minimal point at t = 0, the phase shift can be 7.5, which corresponds to one-fourth of the period.
d. If you were on this ride, how high would you be above the ground after 20 minutes?
Answer:
H(20) = 260 sin (\(\frac{2 \pi}{30}\)(20 – 7.5)) + 280
H(20) = 410
You are 410 feet above the ground.
e. Suppose the ride costs $25. How much does 1 minute of riding time cost? How much does 1 foot of riding distance cost? How much does 1 foot of height above the ground cost?
Answer:
Because \(\frac{25}{30}=\frac{5}{6}\) ≈ 0. 83, one minute of riding time costs roughly 83 cents. The circumference of the circle is 52oπ ft. Dividing 25 by the circumference indicates that each 1 foot of ride costs about 1.5 cents. The height of the wheel is 550 feet. Dividing 25 by 550 indicates that each 1 foot above the ground costs about 4.5 cents.
f. What are some of the limitations of this model based on the assumptions that we made?
Answer:
We are assuming that the wheel does not stop to add additional passengers when each car gets to the bottom of the wheel during the ride. We are neglecting the fact that the ride starts from a resting position, so its initial speed would be zero. It would take some time to get up to a constant speed once the ride started and slow down to a stop at the end of the ride. We are measuring the height where the passenger car connects to the wheel. In reality, a person on the ride might be slightly higher or lower than this point depending on the design.
Question 3.
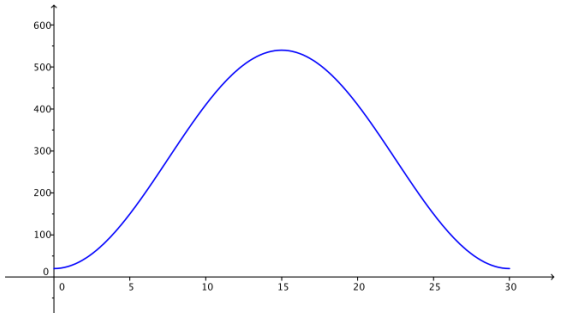
Once in motion, a pendulum’s distance varies sinusoidally from 12 feet to 2 feet away from a wall every 12 seconds.
a. Sketch the pendulum’s distance D from the wall over a 1-minute interval as a function of time t. Assume t = 0 corresponds to a time when the pendulum was furthest from the wall.
Answer:
b. Write a sinusoidal function for D, the pendulum’s distance from the wall, as a function of the time since it was furthest from the wall.
Answer:
D(t) = 5 cos(\(\frac{2 \pi}{24}\)t) + 8
c. Identify two different times when the pendulum was 10 feet away from the wall. (Hint: Write an equation, and solve it graphically.)
Answer:
5 cos(\(\frac{2 \pi}{24}\)t) + 8 = 10
The first two positive solutions to this equation are 4.47 seconds and 19.57 seconds.
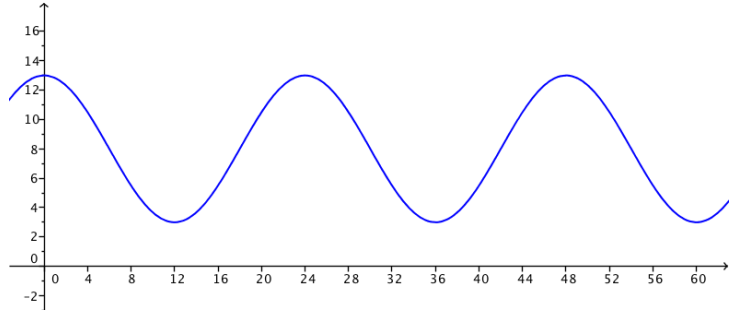
Question 4.
The height in meters relative to the starting platform height of a car on a portion of a roller coaster track is modeled by the function H(t) = 3 sin (\(\frac{\pi}{4}\)(t – 10)) – 7. It takes a car 24 seconds to travel on this portion of the track, which starts 10 seconds into the ride.
a. Graph the height relative to the starting platform as a function of time over this time interval.
Answer:
b. Explain the meaning of each parameter in the height function in terms of the situation.
Answer:
The amplitude 3 means that the height ranges vertically a total distance of 6 feet. The graph completes one cycle every 8 seconds because the period is 8. The phase shift of 10 and the midline equation of y = – 7 indicate that this car is 7 feet below the platform after 10 seconds, and at this point, the car is ascending.
Question 5.
Given the following function, use the parameters to formulate a real-world situation involving one dimension of circular motion that could be modeled using this function. Explain how each parameter of the function relates to your situation.
f(x) = 10 sin(\(\frac{\pi}{8}\)(x – 3)) + 15
Answer:
Student scenarios will vary; however, f should represent a horizontal or vertical distance from a reference point as a point is in motion around a circle, and x should be an amount of rotation or a time (assuming constant rotation speed). The radius of the circle should be 10. The object should rotate around the circle once every 16 units. When x = 3, the object’s distance from the reference point should be 15 units, and its distance from the reference point should be increasing.
Eureka Math Algebra 2 Module 2 Lesson 12 Exit Ticket Answer Key
The Ferris Wheel Again
In an amusement park, there is a small Ferris wheel, called a kiddie wheel, for toddlers. The points on the circle in the diagram to the right represent the position of the cars on the wheel. The kiddie wheel has four cars, makes one revolution every minute, and has a diameter of 20 feet. The distance from the ground to a car at the lowest point is 5 feet. Assume t = 0 corresponds to a time when car 1 is closest to the ground.
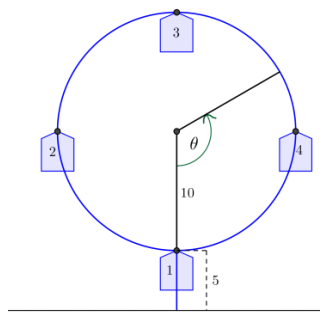
Question 1.
Sketch the height function for car 1 with respect to time as the Ferris wheel rotates for two minutes.
Answer:
Question 2.
Find a formula for a function that models the height of car 1 with respect to time as the kiddie wheel rotates.
Answer:
The horizontal shift is h = \(\frac{1}{4}\), the amplitude is 10, and the equation for the midline is y = 15. Since the wheel makes
one revolution every minute, the period of this function will be 1. Thus, ω = \(=\frac{2 \pi}{1}\) = 2π.
H(t) = 10 sin (2π (t – \(\frac{1}{4}\))) + 15
Question 3.
Is your function in Question 2 the only function that models this situation? Explain how you know.
Answer:
No, any phenomenon that we can model with a sine function can also be modeled with a cosine function using an appropriate horizontal shift and/or reflection about the horizontal axis. Other functions include
H(t) = -10 cos(2πt) + 15 or H(t) = 10 cos (2π (t – \(\frac{1}{4}\))) + 15.
A sine function with a different combination of horizontal translations and reflections could also work.