Engage NY Eureka Math Algebra 2 Module 2 Lesson 11 Answer Key
Eureka Math Algebra 2 Module 2 Lesson 11 Example Answer Key
Graph the following function
f(x) = 3 sin (4 (x – \(\frac{\pi}{6}\))) + 2
Answer:
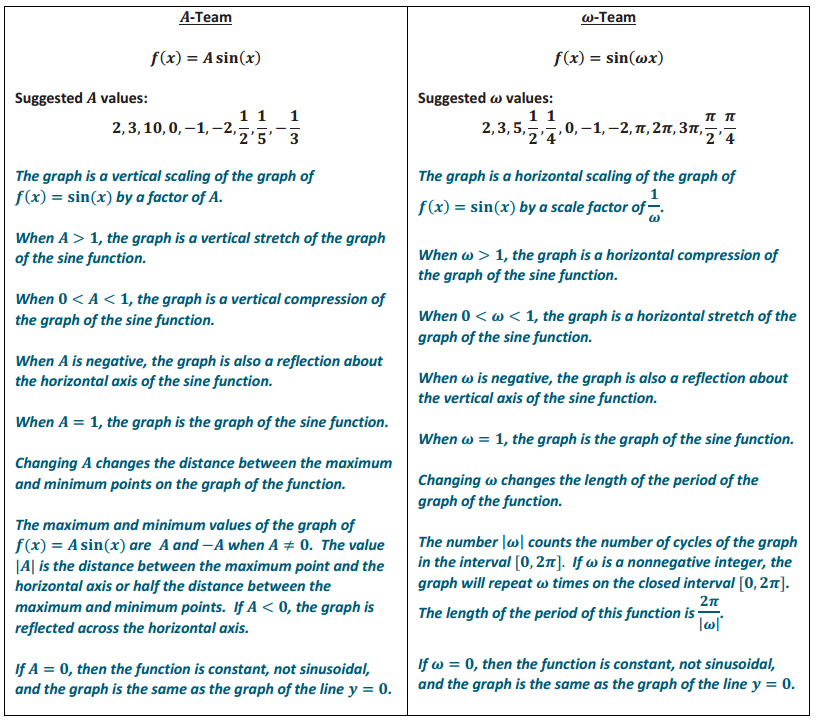
→ What are the values of the parameters ω, h, A, and k, and what do they mean?
ω = 4, h = ,A = 3, and k = 2.
The value of ω affects the period. The period is P = \(\frac{2 \pi}{|\omega|}=\frac{\pi}{2}\) The graph of this function is a horizontal scaling of the graph of the sine function by a factor of \(\frac{1}{4}\). The graph of this function has four cycles in the closed interval [0, 2π].
The phase shift is \(\frac{\pi}{6}\). After shifting the period, we translate the graph \(\frac{\pi}{6}\) units to the right.
The amplitude is 3. The graph of this function is a vertical scaling of the graph of the sine function by a factor of 3. The vertical distance between the maximal and minimal points on the graph of this function is 6 units.
The graph of the equation y = 2 is the midline. We translate the graph we have constructed so far 2 units upward.
Model the effects of each parameter compared to the graph of the sine function by sketching by hand, using a graphing calculator, or using other graphing software. If, when questioned, students are still using colloquial phrases such as “the graph will squish inward,” then take time to correct their terminology as modeled in the answers below.
→ First, we consider the parameter ω, which affects both period and frequency. What happens when ω = 4?
The period is smaller than the period of the sine function. The graph is a horizontal scaling of the original graph by a scale factor of \(\frac{1}{4}\).
The blue curve is the graph of y = sin(4x). Be sure to point out the length of the period and that there are four cycles.of the graph on the interval [0, 2π] because ω = 4.
→ Next, we examine the horizontal translation by h = \(\frac{\pi}{6}\) What effect does that have on the graph?
The new graph is the old graph shifted \(\frac{\pi}{6}\) units to the right.
The blue curve is the graph of y = sin (4 (x – \(\frac{\pi}{6}\)) Notice that the point that used to be (0, 0) has now been shifted to (\(\frac{\pi}{6}\), 0)
→ The next step is to look at the effect of A = 3. What does that do to our graph? How does it compare to the previous graph?
The amplitude is 3, so the distance between the maximum points and the minimum points is 6 units.
The graph of this function is the graph of the previous function scaled vertically by a factor of 3.
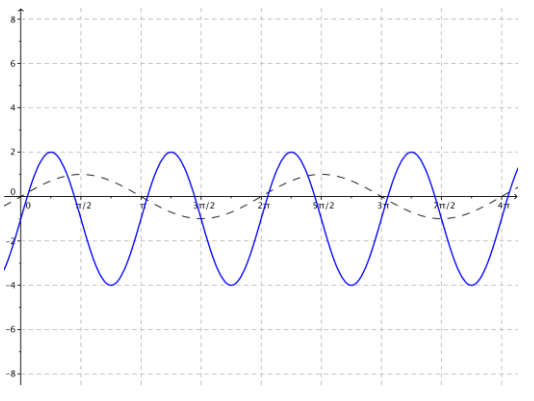
The blue curve is the graph of y = 3 sin(4 (x – \(\frac{\pi}{6}\))).
→ What happens to the zeros of a sinusoidal function with midline along the horizontal axis when the amplitude is changed? How about when the other parameters are changed? Support your claim with evidence.
The zeros of the function do not change when we change the amplitude because sin(ω(x – h)) = 0 and A sin(ω(x – h)) = 0 have the same solution sets. You can observe this by comparing graphs of functions f(x) = A sin(ω(x – h)) for different values of A. When you change the other parameters, the zeros change unless the changed parameter causes the graph of the new function to be a reflection of the original function, or the changed parameter causes the graph of the new function to be a horizontal translation of the original function that shifts the zeros onto themselves.
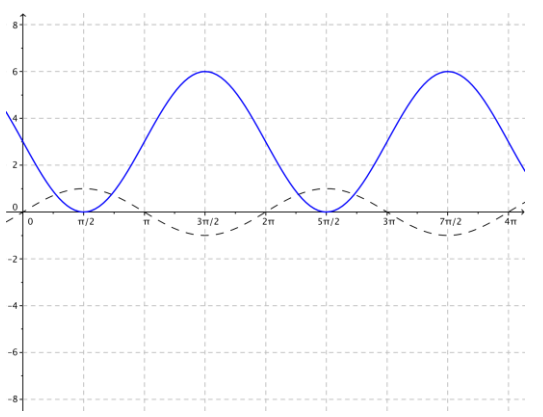
The final change is to consider the effect of k = 2. This gives us the final graph, which is the graph of the function f(x) = 3 sin (4 (x –\(\frac{\pi}{6}\))) + 2. What happens to the graph of this function when k = 2?
The new graph is the previous graph translated vertically by 2 units.
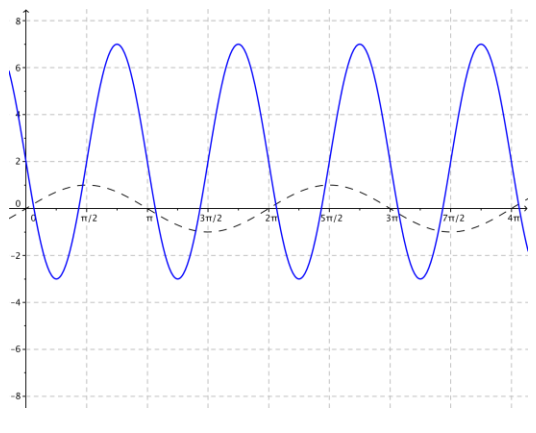
The blue curve is the graph of the function desired: f(x) = 3 sin (4 (x –\(\frac{\pi}{6}\))) + 2.
Eureka Math Algebra 2 Module 2 Lesson 11 Opening Exercise Answer Key
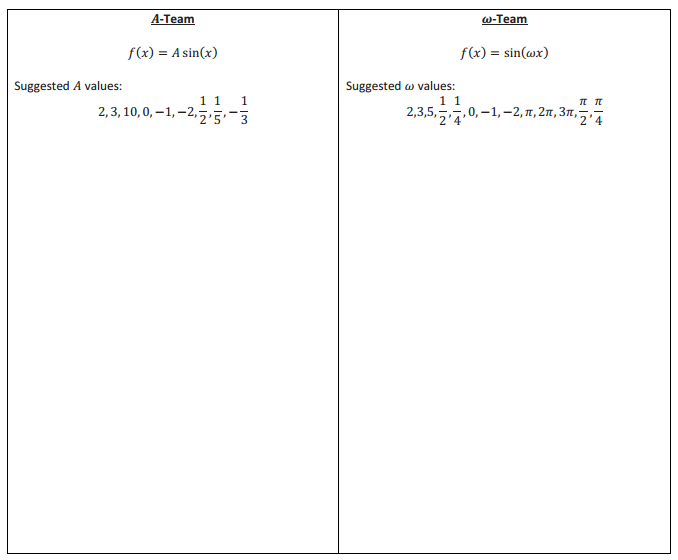
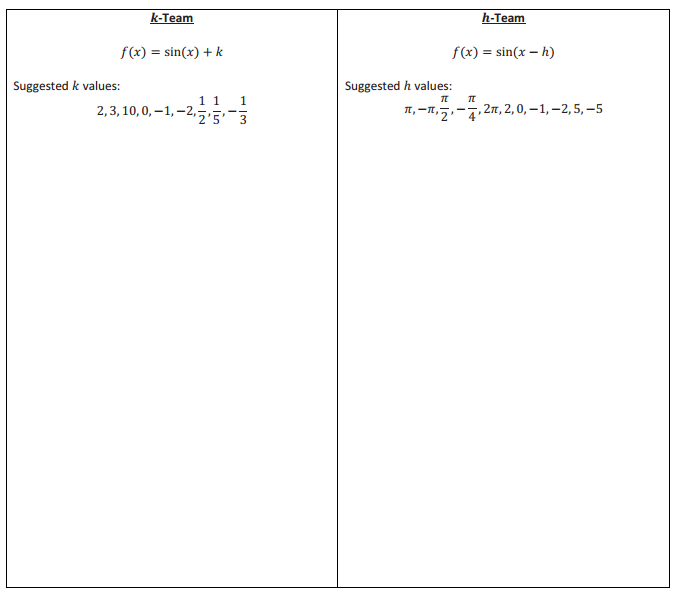
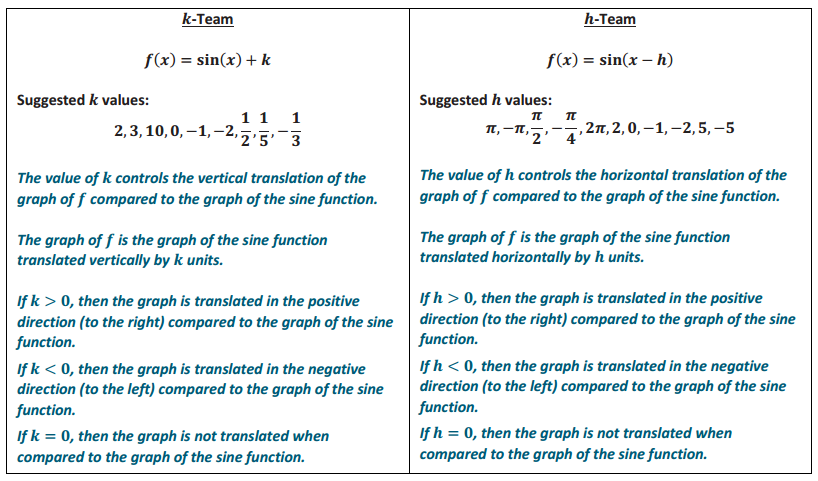
Explore your assigned parameter in the sinusoidal function f(x) = A sin(ω(x – h)) + k. Select several different values for your assigned parameter, and explore the effects of changing the parameter’s value on the graph of the function compared to the graph of f(x) = sin(x). Record your observations in the table below. Include written descriptions and sketches of graphs.
Answer:
Answer:
Eureka Math Algebra 2 Module 2 Lesson 11 Exercise Answer Key
For each function, indicate the amplitude, frequency, period, phase shift, vertical translation, and equation of the midline. Graph the function together with a graph of the sine function f(x) = sin(x) on the same axes. Graph at least one full period of each function.
a. g(x) = 3 sin(2x) – 1
Answer:
Since A = 3, the amplitude is 3.
Since ω = 2, the frequency is f = \(\frac{|\omega|}{2 \pi}=\frac{1}{\pi}\)
The period is P = \(\frac{2 \pi}{|\omega|}\) = π.
Since h = 0, the phase shift is 0, and there is no horizontal translation.
The vertical translation is 1 unit downward since k = – 1.
The midline has equation y = – 1.
b. g(x) = \(\frac{1}{2}\)sin (\(\frac{1}{4}\)x + π)
Answer:
Since A = \(\frac{1}{2}\), the amplitude is \(\frac{1}{2}\).
Since ω = \(\frac{1}{4}\), the frequency is f = \(\frac{|\omega|}{2 \pi}=\frac{1}{8 \pi}\)
The period is P = \(\frac{2 \pi}{|\omega|}\) = 8π.
Since h = – π, the phase shift is – π. Thus, the graph is translated horizontally π units to the left.
There is no vertical translation since k = 0.
The midline is the graph of y = 0.
c. g(x) = 5sin(-2x) + 2
Answer:
Since A = 5, the amplitude is 5.
Since ω = 2, the frequency is f \(\frac{|\omega|}{2 \pi}=\frac{1}{\pi}\)
The period is P = \(\frac{2 \pi}{|\omega|}\) = π.
Since the phase shift is h = 0, there is no horizontal translation.
Since k = 2, the vertical translation is 2 units upward.
The midline is the graph of y = 2.
The graph is reflected across the vertical axis since ω < 0.
d. g(x) = -2 sin (3 (x + \(\frac{\pi}{6}\)))
Answer:
Since A = – 2, the amplitude is |-2| = 2.
Since ω = 3, the frequency is f = \(\frac{|\omega|}{2 \pi}=\frac{3}{2 \pi}\)
The period is P =\(\frac{|\omega|}{2 \pi}=\frac{3}{2 \pi}\).
Since h = \(\frac{\pi}{6}\), the phase shift is \(\frac{\pi}{6}\). Thus, the graph is translated horizontally \(\frac{\pi}{6}\) units to the right.
There is no vertical translation since k = 0.
The midline is the graph of y = 0.
The graph is reflected across the horizontal axis since A < 0.
e. g(x) = 3 sin(x + π) + 3
Answer:
Since A = 3, the amplitude is 3.
Since ω = 1, the frequency is f = \(\)
The period is P = \(\) = 2π.
Since h = -π, the phase shift is -π. Thus, the graph is translated horizontally π units to the left.
Since k = 3, the graph is translated vertically 3 units upward.
The midline is the graph of y = 3.
f. g(x) = –\(\frac{2}{3}\) sin(4x) – 3
Answer:
Since A = –\(\frac{2}{3}\) the amplitude is \(\left|-\frac{2}{3}\right|=\frac{2}{3}\)
Since ω = 4, the frequency is f = \(\frac{|\omega|}{2 \pi}=\frac{2}{\pi}\)
The period is P = \(\frac{2 \pi}{|\omega|}=\frac{\pi}{2}\).
Since h = 0, the phase shift is 0, and there is no horizontal translation.
Since k = – 3, the vertical translation is 3 units down ward.
The midline is the graph of y = – 3.
Since A < 0, the graph is reflected about the horizontal axis.
g. g(x) = π sin \(\left(\frac{x}{2}\right)\) + π
Answer:
Since A = π, the amplitude is π.
Since ω = \(\frac{1}{2}\) the frequency is f = \(\frac{|\omega|}{2 \pi}=\frac{1}{4 \pi}\)
The period is P = \(\frac{2 \pi}{|\omega|}\) = 4π.
Since h = 0, the phase shift is 0, and there is no horizontal translation.
Since k = π, the graph is translated vertically ir units upward.
The midline is the graph of y = π.
h. g(x) = 4 sin (\(\frac{1}{2}\) (x – 5π))
Answer:
Since A = 4, the amplitude is 4.
Since ω = \(\frac{1}{2}\), the frequency is f = \(\frac{|\omega|}{2 \pi}=\frac{1}{4 \pi}\)
The period is P = \(\frac{2 \pi}{|\omega|}\) = 4π.
Since h = 5π, the phase shift is 5π. Thus, the graph is translated horizontally 5π units to the right.
Since k = 0, there is no vertical translation.
The midline is the graph of y = 0.
Eureka Math Algebra 2 Module 2 Lesson 11 Problem Set Answer Key
Question 1.
For each function, indicate the amplitude, frequency, period, phase shift, horizontal and vertical translations, and equation of the midline. Graph the function together with a graph of the sine function f(x) = sin(x) on the same axes. Graph at least one full period of each function. No calculators are allowed.
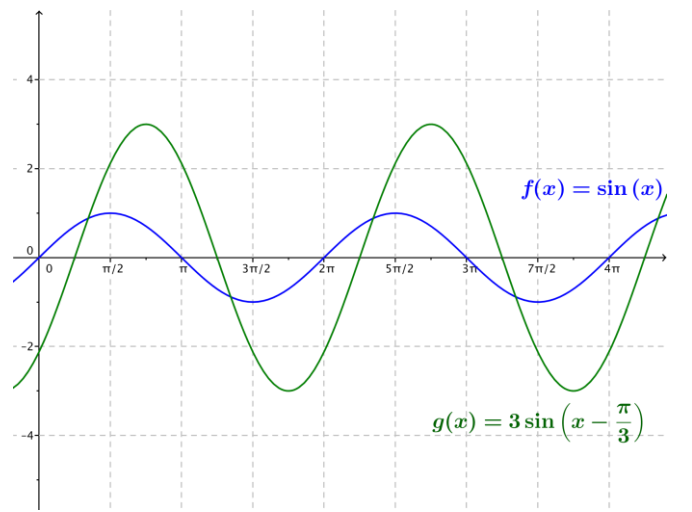
a. g(x) = 3 sin (x – \(\frac{\pi}{4}\))
Answer:
The amplitude is 3, the frequency is \(\frac{1}{2 \pi}\), the period is 2π, and the phase shift is \(\frac{\pi}{4}\). The graph is translated horizontally \(\frac{\pi}{4}\) units to the right; there is no vertical translation, and the equation of the midline is y = 0.
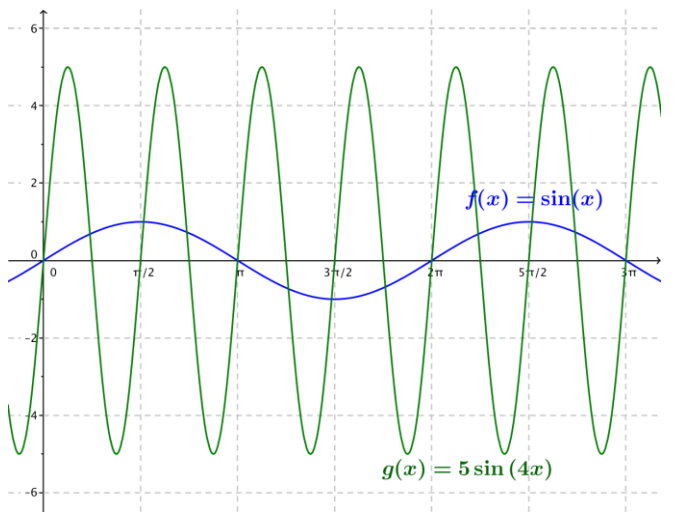
b. g(x) = 5 sin(4x)
Answer:
The amplitude is 5, the frequency is \(\frac{2}{\pi}\), the period is \(\frac{\pi}{2}\), and the phase shift is 0. There are no horizontal or vertical translations, and the equation for the midline is y = 0. The graph is a vertical scaling of the graph of \(\frac{1}{4}\).
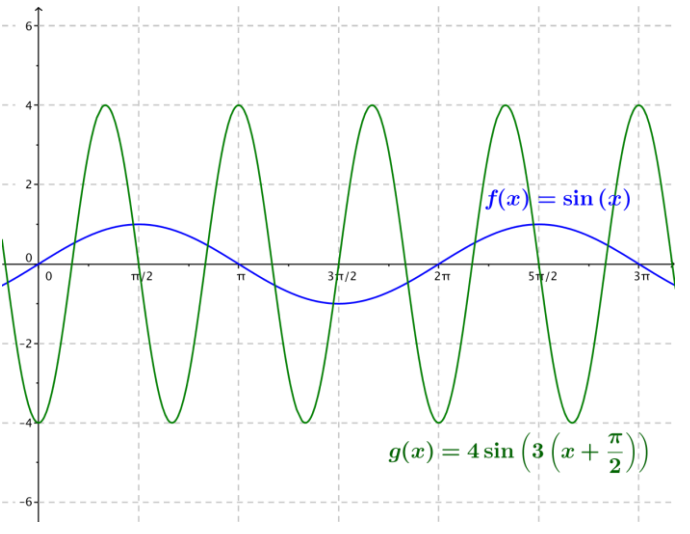
c. g(x) = 4 sin (3(x + \(\frac{\pi}{2}\)))
Answer:
The graph of f is the graph of the sine function scaled vertically by a factor of 4, horizontally by a factor of \(\frac{1}{3}\), and translated \(\frac{\pi}{2}\) to the left. The amplitude is 4, the frequency is \(\frac{3}{2 \pi}\), the period is \(\frac{2 \pi}{3}\), the phase shift is – \(\frac{\pi}{2}\), and the equation for the midline is y = 0.
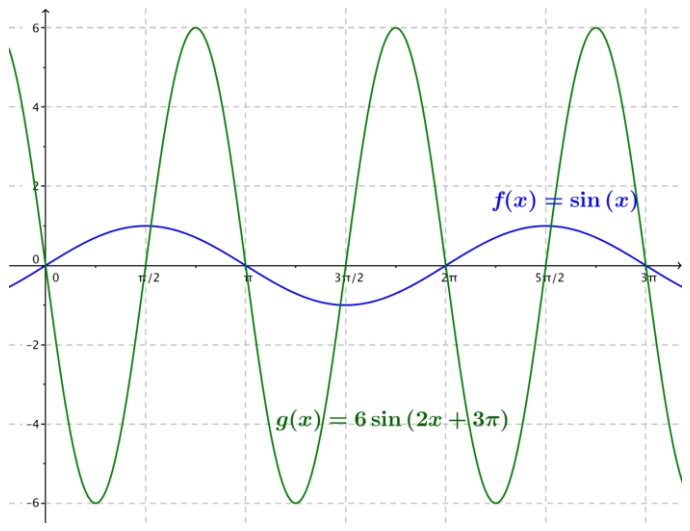
d. g(x) = 6 sin(2x + 3π) (Hint: First, rewrite the function in the form g(x) = A sin(ω(x – h)).)
Answer:
Rewriting the expression for g, we get 6 sin(2x + 3π) = 6 sin (2 (x + \(\)π\frac{3}{2})).me graph of g is the graph of the sine function scaled vertically by a factor of 6, horizontally by a factor of \(\frac{1}{2}\) and translated horizontally \(\frac{3}{2}\)π to the left. Thus, the amplitude is \(\frac{1}{\pi}\), the frequency is -, the period is ir, the phase shift is – \(\frac{3}{2}\)π, and the equation for the midline is y = 0.
Question 2.
For each function, indicate the amplitude, frequency, period, phase shift, horizontal and vertical translations, and equation of the midline. Graph the function together with a graph of the sine function f(x) = cos(x) on the same axes. Graph at least one full period of each function. No calculators are allowed.
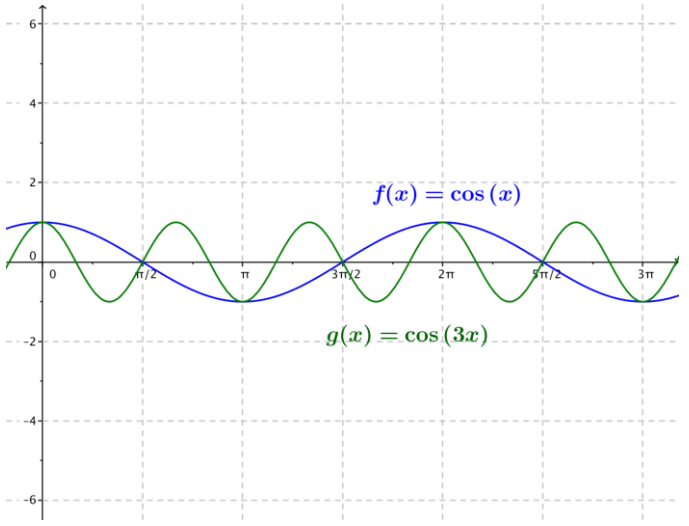
a. g(x) = cos(3x)
Answer:
The amplitude is 1, the frequency is \(\frac{3}{2 \pi}\) the period is \(\frac{2}{3}\) π, and the phase shift is 0. There are no horizontal or vertical translations, and the equation of the midline is y = 0.
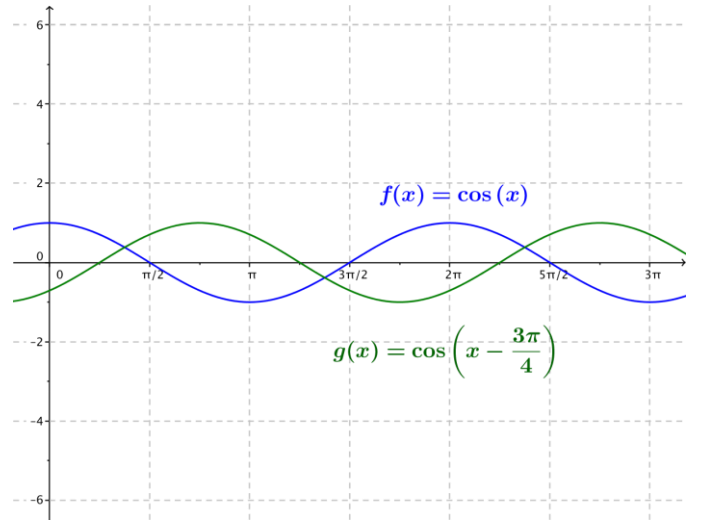
b. g(x) = cos(x – \(\frac{3 \pi}{4}\))
Answer:
The amplitude is 1, the frequency is \(\frac{1}{2 \pi}\), the period is 2π, and the phase shift is \(\frac{3 \pi}{4}\). The horizontal translation is \(\frac{\pi}{3}\) units to the right, there is no vertical translation, and the equation of the midline is y = 0.
c. g(x) = 3 cos \(\left(\frac{x}{4}\right)\)
Answer:
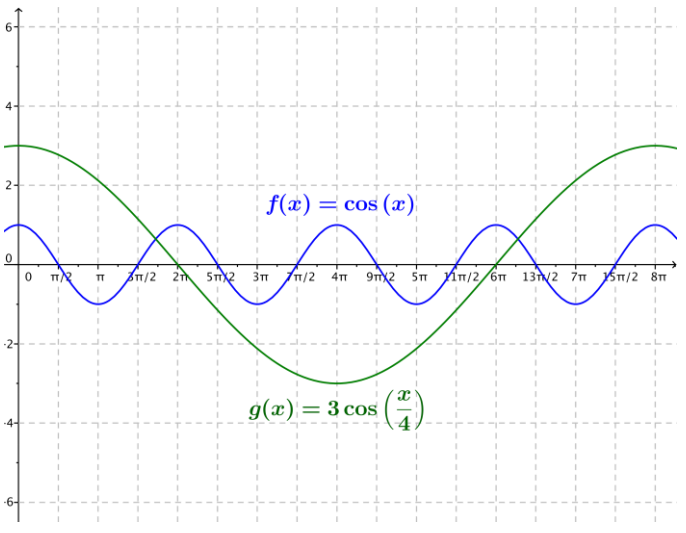
The amplitude is 3, the frequency is \(\frac{1}{8 \pi}\), the period is 8π, and the phase shift is 0. There are no horizontal or vertical translations, and the equation for the midline is y = 0. The graph of g is a vertical scaling of the graph of the cosine function by a factor of 3 and a horizontal scaling of the graph of the cosine function by a factor of 4.
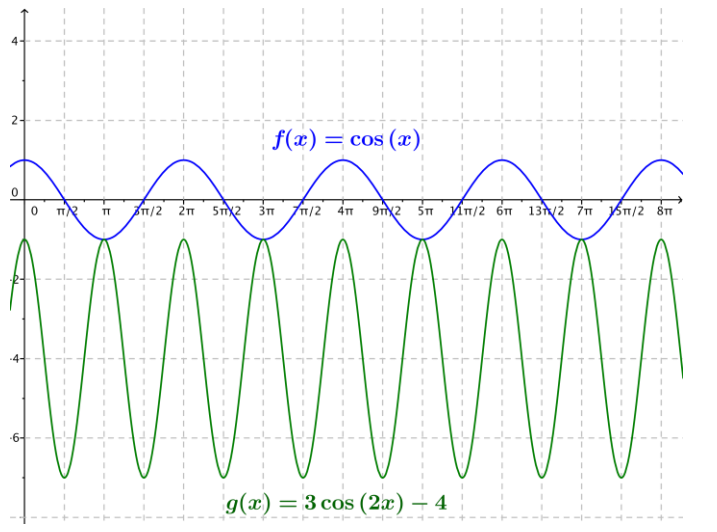
d. g(x) = 3 cos(2x) – 4
Answer:
The amplitude is 3, the frequency is \(\frac{1}{\pi}\), the period is π, and the phase shift is 0. There is no horizontal translation, the graph is translated vertically down 4 units, and the equation for the midline is y = – 4.
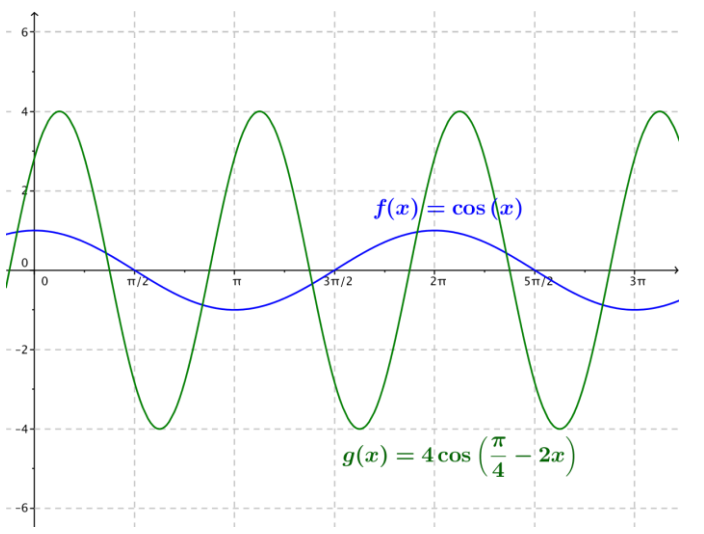
e. g(x) = 4 cos (\(\frac{\pi}{4}\) – 2x) (Hint: First, rewrite the function in the form g(x) = A cos(ω(x – h)).)
Answer:
Rewriting the expression, we see that 4 cos (\(\frac{\pi}{4}\) – 2x) = 4 cos(- 2 (x – \(\frac{\pi}{8}\))) = 4 cos (2 (x – \(\frac{\pi}{8}\))). The graph of g is the graph of the cosine function scaled vertically by a factor of 4, horizontally by a factor of \(\frac{1}{2}\), and then translated horizontally \(\frac{\pi}{8}\) units to the right. This tells us that the amplitude is 4, the frequency is \(\frac{1}{\pi}\), the period is π, the phase shift is \(\frac{\pi}{8}\), and the equation for the midline is y = 0.
Question 3.
For each problem, sketch the graph of the pairs of indicated functions on the same set of axes without using a calculator or other graphing technology.
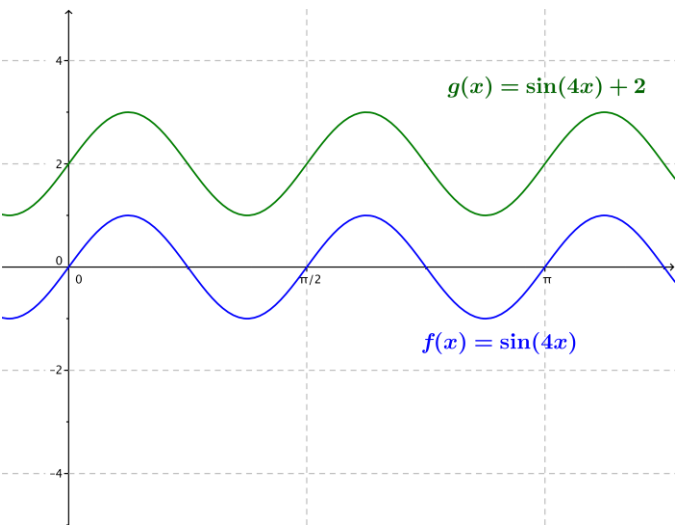
a. f(x) = sin(4x), g(x) = sin(4x) + 2
Answer:
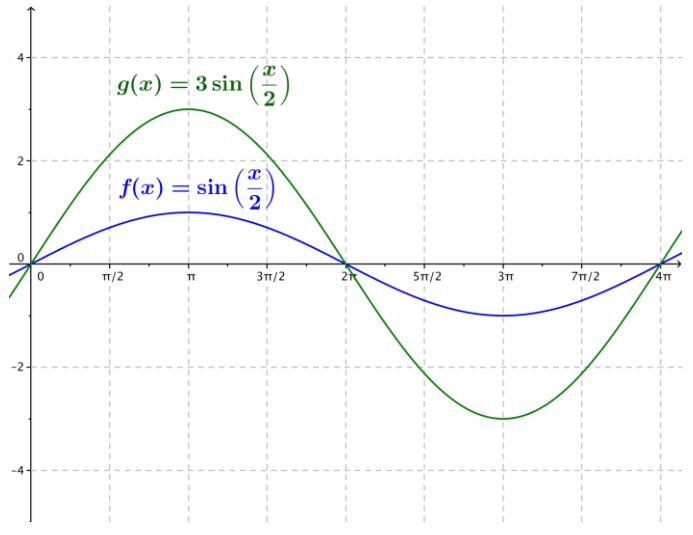
b. f(x) = sin(\(\frac{1}{2}\)x), g(x) = 3 sin (\(\frac{1}{2}\)x)
Answer:
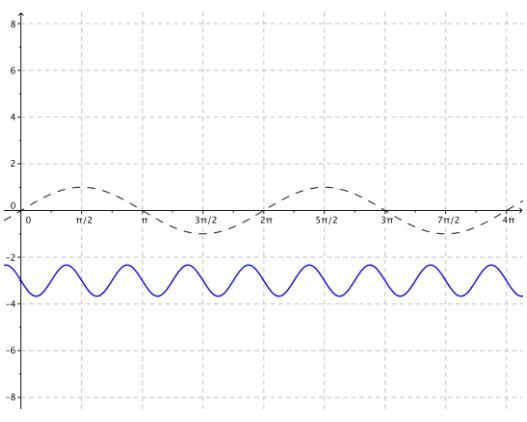
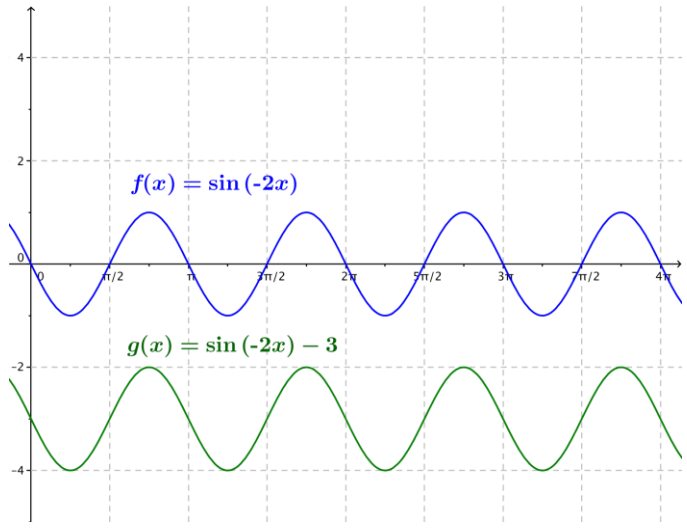
c. f(x) = sin(-2x), g(x) = sin(-2x) – 3
Answer:
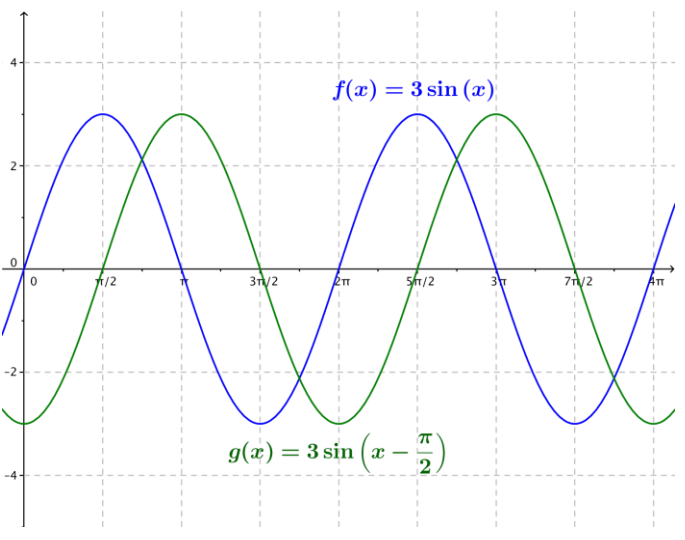
d. f(x) = 3 sin(x), g(x) = 3 sin (x – \(\frac{\pi}{2}\))
Answer:
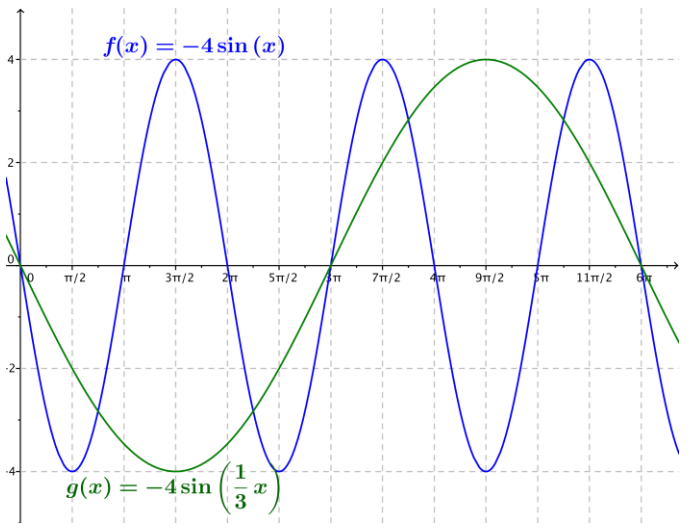
e. f(x) = -4sin(x), g(x) = -4 sin (\(\frac{1}{3}\)x)
Answer:
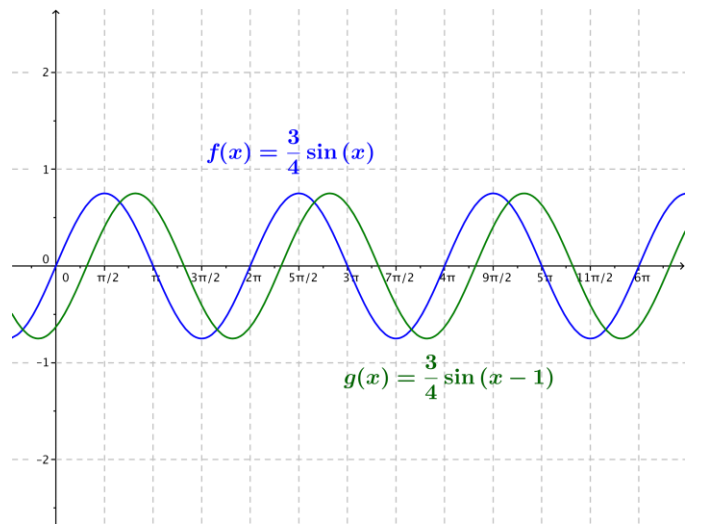
f. f(x) = \(\frac{3}{4}\)sin(x), g(x) = \(\frac{3}{4}\)sin(x – 1)
Answer:
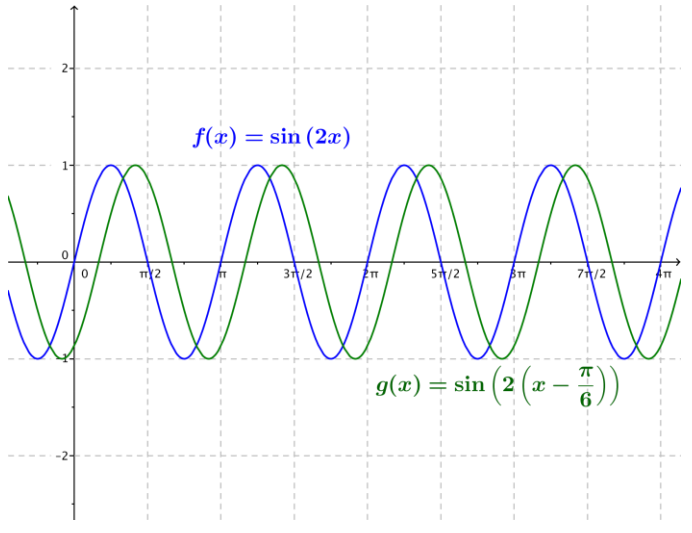
g. f(x) = sin(2x), g(x) = sin (2 (x – \(\frac{\pi}{6}\)))
Answer:
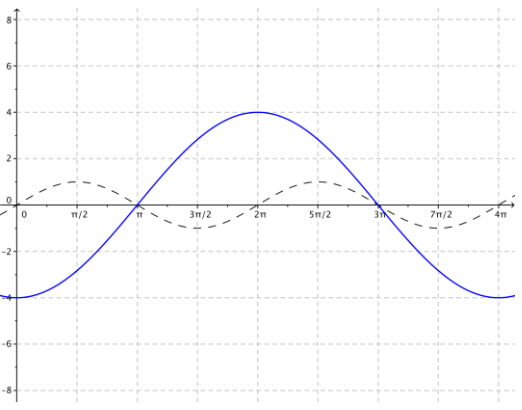
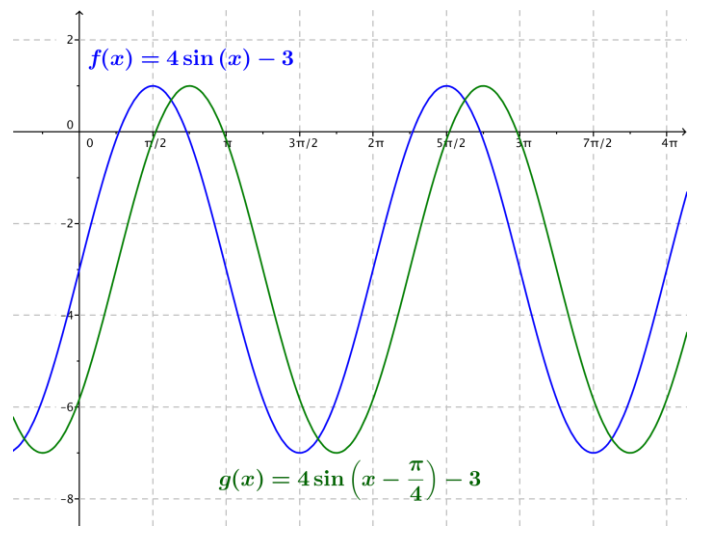
h. f(x) = 4sin(x) – 3, g(x) = 4 sin(x – \(\frac{\pi}{4}\)) – 3
Answer:
Extension:
Question 4.
Show that if the graphs of the functions f(x) = A sin(ω(x – h1)) + k and g(x) = A sin(ω(x – h2)) + k are the same, then h1 and h2 differ by an integer multiple of the period.
Answer:
Outline of proof: Since functions f and g have the same graph, the functions have the same period P. For all values of x, the fact that the sine graphs are the same gives
A sin(ω(x – h1)) = A sin(ω(x – h1))
sin (ω(x – h1)) = sin(ω(x – h1))
ω(x – h1) – ω(x – h2) = n2π
\(\frac{2 \pi}{P}\)(x – h1) – \(\frac{2 \pi}{P}\) (x – h2) = n2π
(x – h1) – (x – h2) = np
h1 – h2 =nP.
Question 5.
Show that if h1 and h2 differ by an integer multiple of the period, then the graphs of f(x) = A sin(ω(x – h1)) + k and g(x) = A sin(ω(x – h2)) + k are the same graph.
Answer:
Outline of proof:
Since h1 and h2 differ by an integer multiple of the period P, there is an integer n so that h2 – h1 = nP.
h2 – h1 = nP
(x – h1) – (x – h2) = nP
\(\frac{2 \pi}{P}\)(x – h1) – \(\frac{2 \pi}{P}\)(x – h2) = n2π
ω(x – h1) – ω(x – h2) = n2π
ω(x – h1) = ω(x – h2) + n2π
sin(ω(x – h1) = sin(ω(x – h2) + n2π)
But, the sine function is periodic with period 2π, so sin(ω(x – h2) + n2π) = sin(ω(x – h2)).
sin(ω(x – h1)) = sin(ω(x – h2))
A sin(ω(x – h1)) = A sin(ω(x – h2))
A sin(ω(x – h1)) + k = A sin(ω(x – h2)) + k
f(x) = g(x).
Since the functions f and g are the same, they have the same graph.
Question 6.
Find the x-intercepts of the graph of the function f(x) = A sin(ω(x – h)) in terms of the period P, where ω > 0.
Answer:
The x-intercepts occur when sin(ω(x – h)) = 0. This happens when ω(x – h) = nπ for integers n.
So, x – h = \(\frac{n \pi}{\omega}\), and then x = \(\frac{n \pi}{\omega}\) + h.
Since P = \(\frac{2 \pi}{\omega}\), this becomes x = \(\frac{n P}{2}\) + h. Thus, the graph of f(x) = A sin(ω(x – h)) has x-intercepts at x = \(\frac{n \pi}{\omega}\) + h for integer values of n.
Eureka Math Algebra 2 Module 2 Lesson 11 Exit Ticket Answer Key
Question 1.
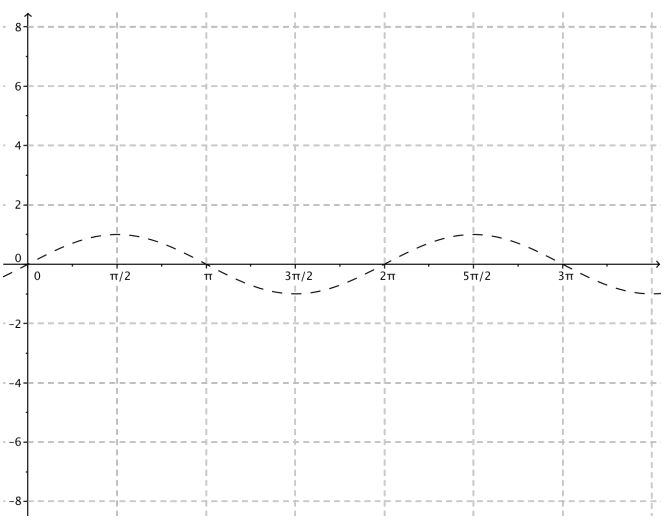
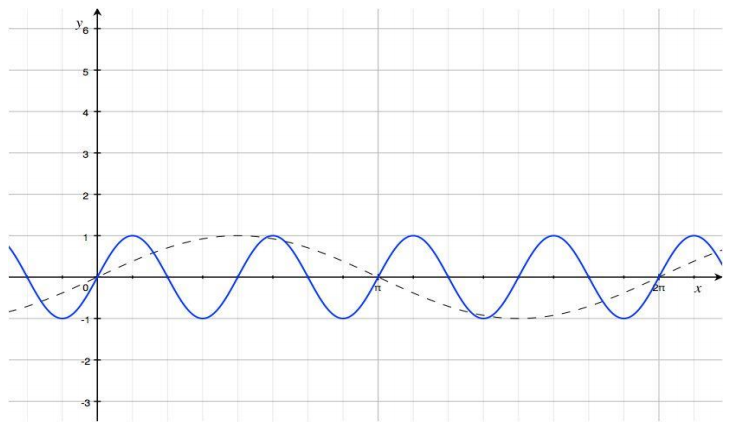
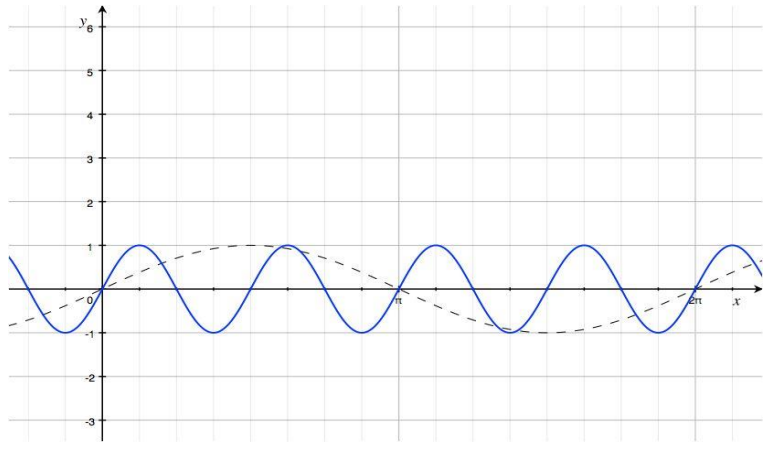
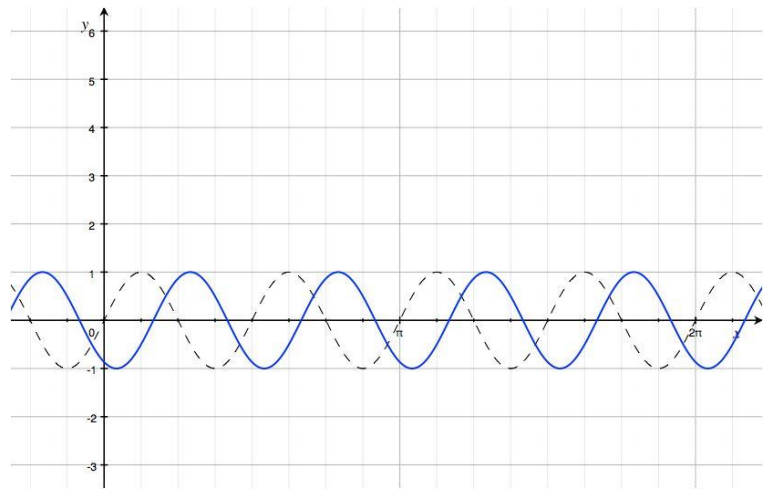
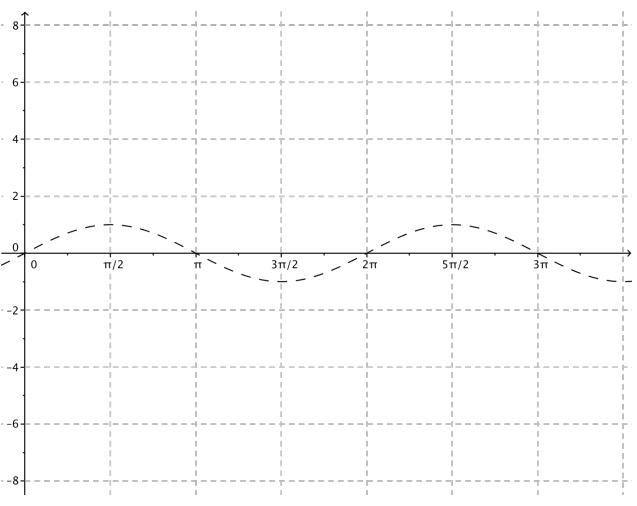
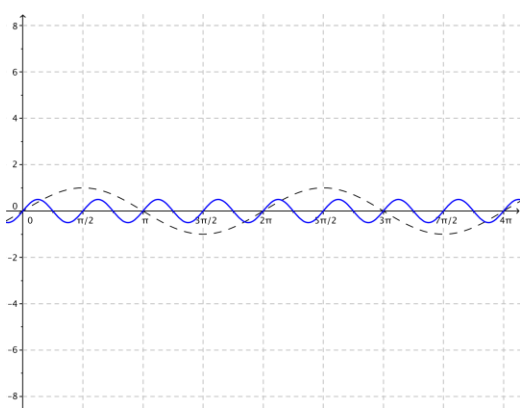
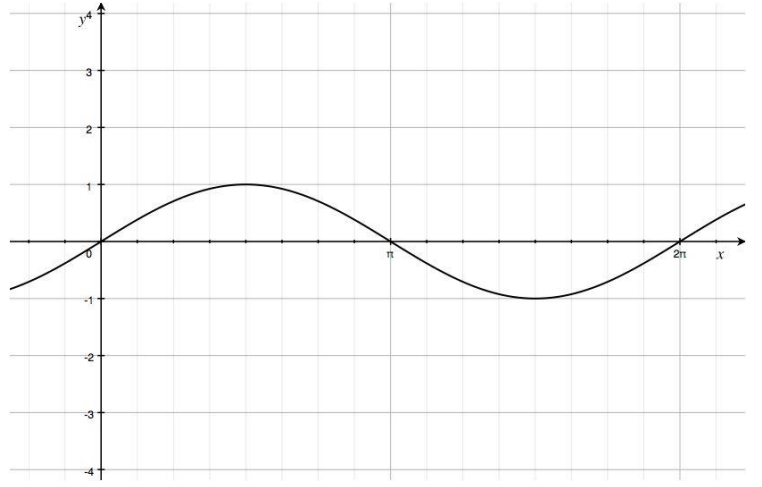
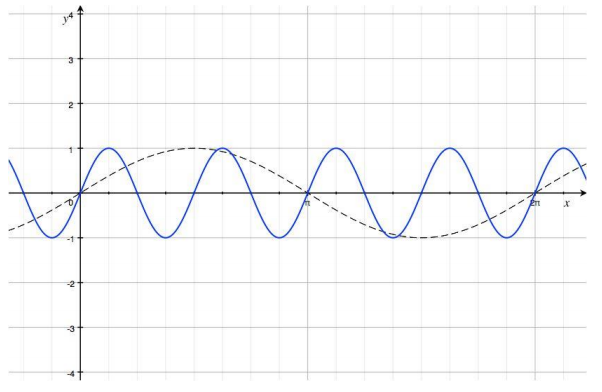
Given the graph of y = sin(x) below, sketch the graph of the function f(x) = sin(4x) on the same set of axes. Explain the similarities and differences between the two graphs.
Answer:
The curve shown in blue is the graph of f(x) = sin(4x), and the dashed curve is the graph of y = sin(x). The graph of f is a horizontal scaling of the graph of the sine function by a factor of \(\frac{1}{4}\). The graph of f(x) = sin(4x) has a different period and frequency than the sine function, which changes the values of the x-intercepts, maximum and minimum points, and the increasing and decreasing intervals for this function. The amplitudes of the two graphs are the same, with |A| = 1.
Question 2.
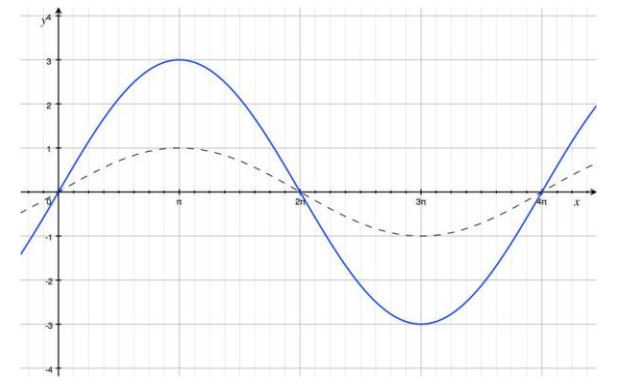
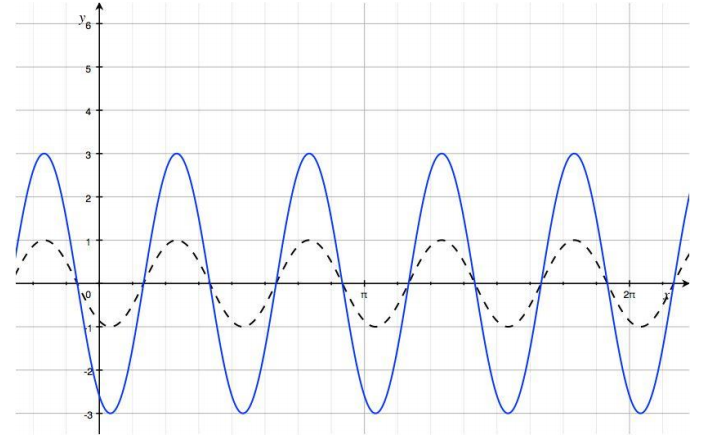
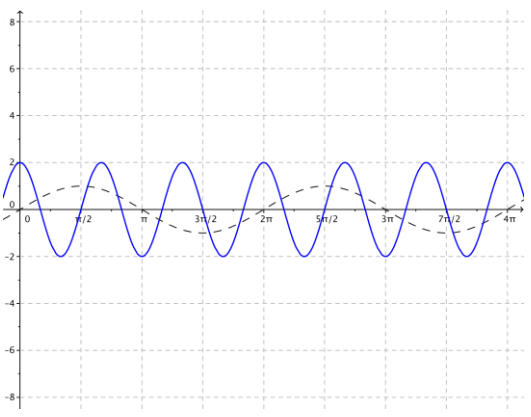
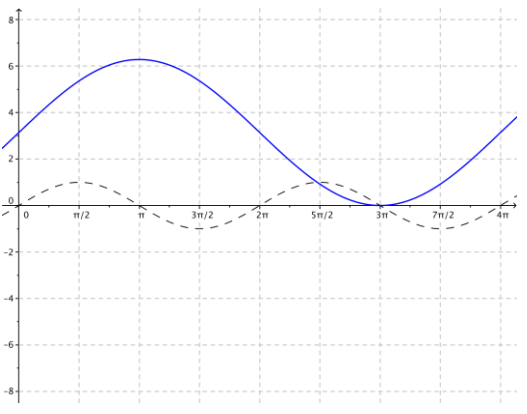
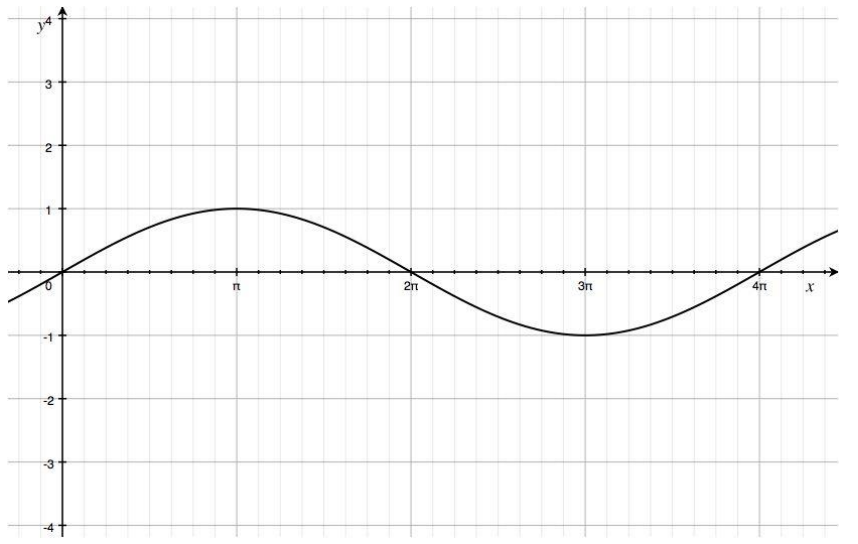
Given the graph of y = sin\(\left(\frac{x}{2}\right)\) below, sketch the graph of the function g(x) = 3sin \(\left(\frac{x}{2}\right)\) on the same set of axes. Explain the similarities and differences between the two graphs.
Answer:
The curve shown ¡n blue ¡s the graph of y = sin \(\left(\frac{x}{2}\right)\), and the dashed curve is the graph of g(x) = 3sin \(\left(\frac{x}{2}\right)\). The graphs have different amplitudes. The graph of g is a vertical scaling of the graph of the sine function by a factor of 3. The y-coordinates of the maximum and minimum points are different for these two graphs. The two graphs have the same horizontal intercepts because the period of each function is 4π.