Engage NY Eureka Math Algebra 2 Module 2 Lesson 1 Answer Key
Eureka Math Algebra 2 Module 2 Lesson 1 Exercise Answer Key
Exercise 1.
Suppose a Ferris wheel has a diameter of 150 feet. From your viewpoint, the Ferris wheel is rotating counterclockwise. We will refer to a rotation through a full 3600 as a turn.
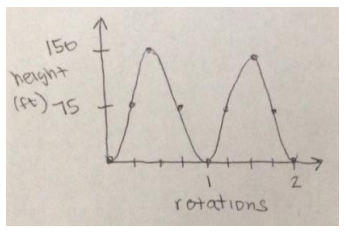
a. Create a sketch of the height of a car that starts at the bottom of the wheel and continues for two turns.
Answer:
b. Explain how the features of your graph relate to this situation.
Answer:
The maximum value is the diameter of the Ferris wheel in feet. The graph repeats because we graphed two turns of the wheel. The minimum values occur when the passenger car is at ground level.
Exercise 2.
Suppose a Ferris wheel has a diameter of 150 feet. From your viewpoint, the Ferris wheel is rotating counter clockwise.
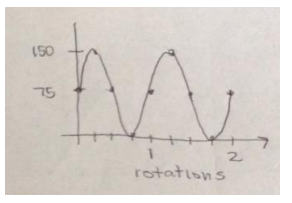
a. Your friends board the Ferris wheel, and the ride continues boarding passengers. Their car is in the three o’clock position when the ride begins. Create a sketch of the height of your friends’ car for two turns.
Answer:
b. Explain how the features of your graph relate to this situation.
Answer:
The maximum value is the diameter of the Ferris wheel in feet. The graph repeats because we graphed two turns of the wheel. The minimum values occur when the passenger car Is at ground level. The vertical intercept of this graph is (0, 75) because we started graphing when the passenger car was at the three o’clock position, which is half the distance to the top of the wheel.
Exercise 3.
How would your sketch change if the diameter of the wheel changed?
Answer:
The maximum and minimum heights would change. The distance between the maximum and minimum heights is the diameter of the wheel. The sketch would be a vertical stretch or a shrinking of the original sketch, depending on whether or not the diameter was respectively larger or smaller than 150 feet.
Exercise 4.
If you translated the sketch of your graph down by the radius of the wheel, what would the x-axis represent in this situation?
Answer:
The x-axis would represent a line through the center of the Ferris wheel that is parallel to the ground.
Exercise 5.
How could we create a more precise sketch?
Answer:
We could measure the height at smaller and smaller increments of rotation.
Eureka Math Algebra 2 Module 2 Lesson 1 Problem Set Answer Key
Question 1.
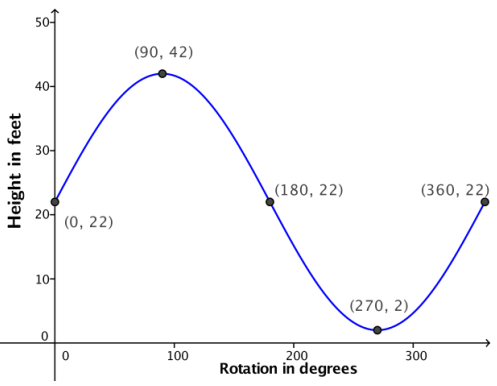
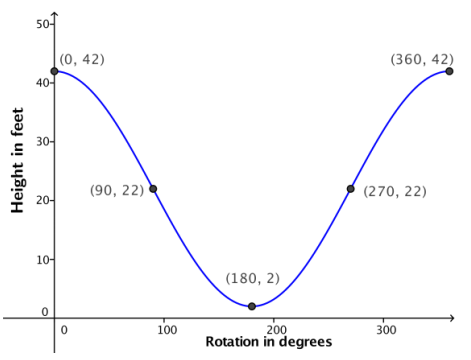
Suppose that a Ferris wheel is 40 feet in diameter and rotates counterclockwise. When a passenger car is at the bottom of the wheel, it Is located 2 feet above the ground.
a. Sketch a graph of a function that represents the height of a passenger car that starts at the 3 o’clock position on the wheel for one turn.
Answer:
b. Sketch a graph of a function that represents the height of a passenger car that starts at the top of the wheel for one turn.
Answer:
c. The sketch you created In part (a) represents a graph of a function. What is the domain of the function? What is the range?
Answer:
The domain is [0, 360]. The range is [2, 42].
d. The sketch you created in part (b) represents a graph of a function. What Is the domain of the function? What is the range?
Answer:
The domain is [0, 360]. The range is [2, 42].
e. Describe how the graph of the function in part (a) would change if you sketched the graph for two turns.
Answer:
The graph would repeat itself over another interval of 360 degrees. It would appear as if we attached a horizontal translation of the graph to the right end of the original graph.
f. Describe how the function in part (a) and its graph would change if the Ferris wheel had a diameter of 60 feet.
Answer:
The function’s range would change to [2, 62], and the graph’s maximum value would be 62 instead of 42. The domain would stay the same, and the x-coordinates where the maximum and minimum values occurred would not change.
Question 2.
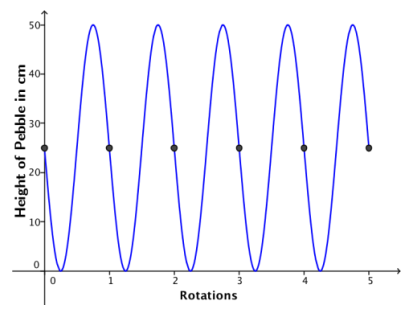
A small pebble is lodged in the tread of a tire with radius 25 cm. Sketch the height of the pebble above the ground as the tire rotates counterclockwise through 5 turns. Start your graph when the pebble is at the 9 o’clock position.
Answer:
Question 3.
The graph you created in Problem 2 represents a function.
a. Describe how the function and its graph would change if the tire’s radius was 24 inches instead of 25 cm.
Answer:
The highest y-value on the graph would be 48 inches instead of 50 centimeters. The function’s range would change to [0, 48].
b. Describe how the function and its graph would change if the wheel was turning in the opposite direction.
Answer:
The graph would increase to a height of 50 cm after \(\frac{1}{4}\) of a turn and then decrease to a height of 0 after of a turn. While the domain and range of the function would remain the same, the actual correspondence between rotations and height would change since the direction of rotation is different.
c. Describe how the function and its graph would change if we started the graph when the pebble was at ground level.
Answer:
Assuming a counterclockwise rotation, a rotation of 0 degrees would be paired with a height of 0, and then after \(\frac{1}{4}\) of a turn, the height would be 25 cm. The domain and range of the function would not change, but the coordinates of the intercepts and maximum and minimum points would change.
Question 4.
Justice believes that the height of a Ferris wheel passenger car is best modeled with a piecewise linear function. Make a convincing argument why a piecewise linear function is NOT a good model for the height of a car on a rotating Ferris wheel.
Answer:
When we measured the height for every 15 degrees of rotation, the height was changing more rapidly at the far left and right positions of the wheel and more slowly near the top and bottom of the wheel Equal increments of rotation did not result in a constant change in the height. If the function was piecewise linear, then equal changes in the rotation should have corresponded to equal changes in height in places.
Eureka Math Algebra 2 Module 2 Lesson 1 Exit Ticket Answer Key
Question 1.
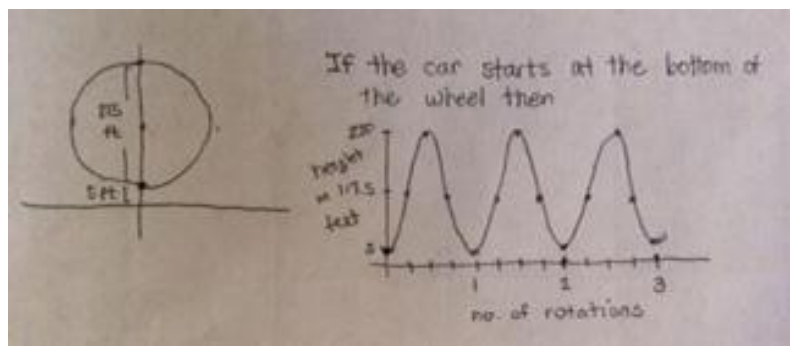
Create a graph of a function that represents the height above the ground of the passenger car for a 225-foot diameter Ferris wheel that completes three turns. Assume passengers board at the bottom of the wheel, which is 5 feet above the ground, and that the ride begins immediately afterward. Provide appropriate labels on the axes.
Answer:
Question 2.
Explain how the features of your graph relate to this situation.
Answer:
The first maximum point on the graph is (180, 230). This shows the height of a passenger car above the ground after half a turn. The car will reach this point again after one and a half and two and a half turns. The first minimum point of the graph is (0, 5). This point represents the height of the passenger car at the bottom of the wheel, and this is where we started the graph. The difference between the maximum and minimum y-coordinates is the diameter of the wheel. When the function increases, the car is rising, and when it decreases, the car is moving back down.
Eureka Math Algebra 2 Module 2 Lesson 1 Exploratory Challenge Answer Key
Exploratory Challenge 1: The Height of a Ferris Wheel Car
George Ferris built the first Ferris wheel in 1893 for the World’s Columbian Exhibition in Chicago. It had 30 passenger cars, was 264 feet tall and rotated once every 9 mInutes when all the cars were loaded. The ride cost $0. 50.

a. Create a sketch of the height of a passenger car on the original Ferris wheel as that car rotates around the wheel 4 times. List any assumptions that you are making as you create your model.
Answer:
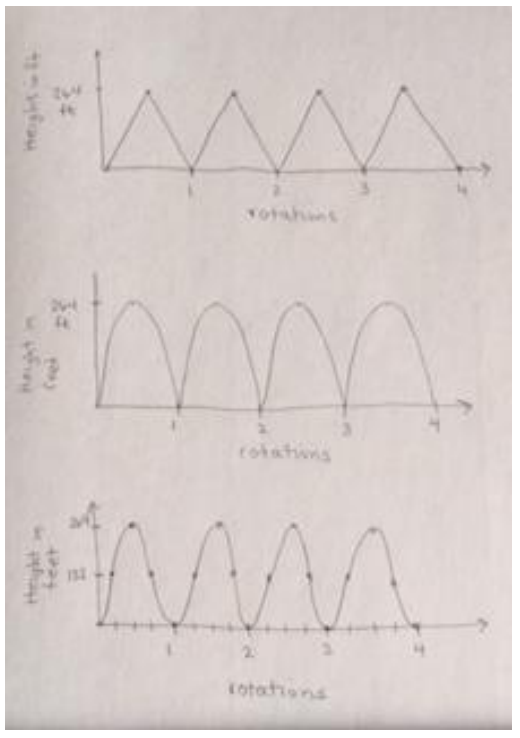
Three possible solutions are shown. Notice that the third response is closest to an actual sinusoidal graph.
We assumed the car was traveling at a constant speed. We assumed that the car we chose started at the bottom of the wheel. We thought about where the car would be every quarter rotation to help us create the graph. We assumed that we were measuring height above the ground and that the car started at a height of 0 units.
b. What type of function would best model this situation?
Answer:
This answer should be consistent with the sketch in Exercise 1. They might respond that the graph could be line segments, so a piecewise linear function would work, or it could be semicircles since the graph is based on the car moving around a circle.
Exploratory Challenge 2: The Paper Plate Model
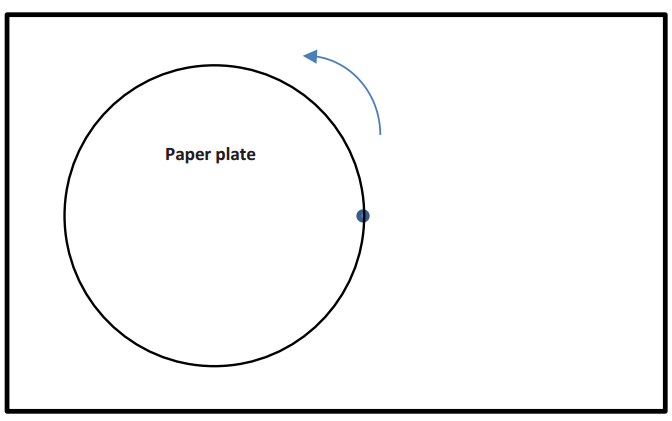
Use a paper plate mounted on a sheet of paper to model a Ferris wheel, where the lower edge of the paper represents the ground. Use a ruler and protractor to measure the height of a Ferris wheel car above the ground for various amounts of rotation. Suppose that your friends board the Ferris wheel near the end of the boarding period, and the ride begins when their car is in the three o’clock position as shown.
a. Mark the diagram below to estimate the location of the Ferris wheel passenger car every 15 degrees. The point on the circle below represents the passenger car in the 3 o’clock position. Since this is the beginning of the ride, consider this position to be the result of rotating by 0°.
Answer:
b. Using the physical model you created with your group, record your measurements in the table, and then graph the ordered pairs (rotation, height) on the coordinate grid shown below. Provide appropriate labels on the axes.
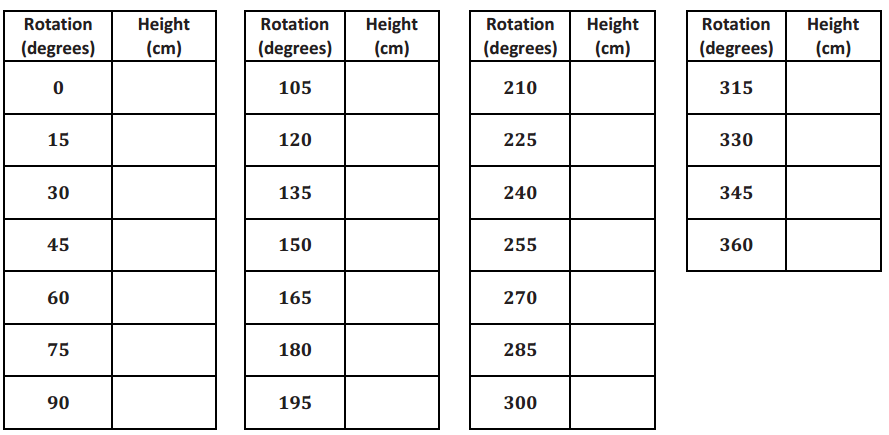
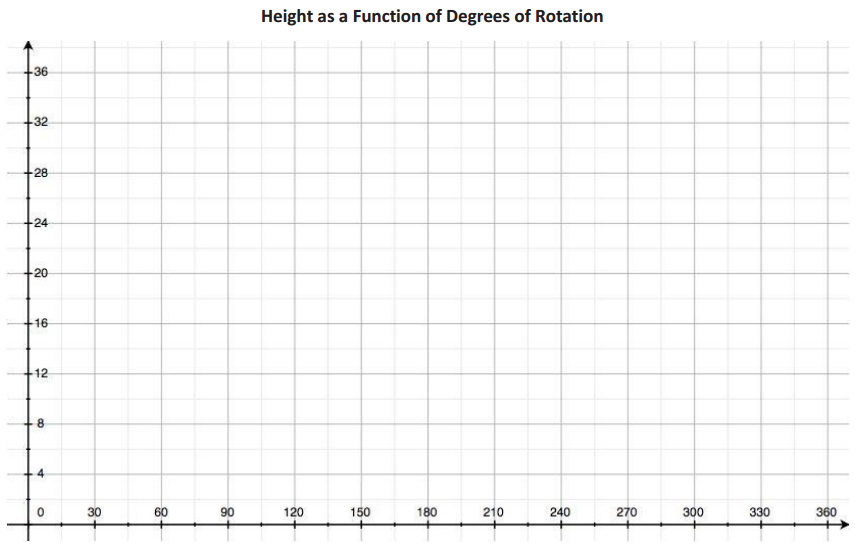
Answer:
Encourage quantitative reasoning by asking students to relate features of the graph to the rotating Ferris wheel. These questions can guide that discussion.
→ How can you identify the diameter of the Ferris wheel from your graph?
It is the vertical distance between the highest and lowest points on the graph.
→If the paper plate model was scaled so that 1 cm on the plate represented 5 ft. on a real Ferris wheel, what is the diameter of the wheel?
Answers will vary depending on plate size, but they should be S times the actual diameter. So, a plate with a 20 cm diameter would represent a 100 ft. diameter Ferris wheel.
→ How high above the ground is the lowest point on the Ferris wheel?
Answers will vary but should correspond to the second coordinate of the minimum point on the graph.
→ Why isn’t the diameter of the Ferris wheel the same as the maximum value on your graph? (Note that some students might have actually placed their plate so that it touches the lower edge of the paper, in which case, this question does not apply.)
It is not the same because we positioned the bottom of our paper plate model above the edge of the paper which represented ground level, a height of 0 ft.
c. Explain how the features of your graph relate to the paper plate model you created.
Answer:
The domain values represent the rotation measured in degrees of a car on the Ferris wheel from the 3 o’clock position for one turn of a passenger car. The range values represent the height of the car above the ground, which we modeled using the bottom edge of the paper. The vertical distance between the maximum and minimum values is the diameter of the paper plate measured in centimeters.
Closing
→ How does a function like the one that represents the height of a passenger car on a Ferris wheel differ from other types of functions you have studied such as linear, polynomial, and exponential functions?
Answer:
→ What is the domain of your Ferris wheel height function? What is the range?
Answer:
→ Provide a definition of periodic function in your own words. Why is the Ferris wheel height function an example of a periodic function?
Answer:
→ What other situations might be modeled by a periodic function?
Answer: