Engage NY Eureka Math Algebra 2 Module 1 Lesson 17 Answer Key
Eureka Math Algebra 2 Module 1 Lesson 17 Opening Exercise Answer Key
In Lesson 16, we created an open-topped box by cutting congruent squares from each corner of a piece of construction paper.
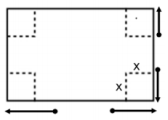
a. Express the dimensions of the box in terms of x.
Answer:
Length: L = 45.7 – 2x
Width: W = 30.5 – 2x
Height: H = x
b. Write a formula for the volume of the box as a function of x. Give the answer in standard form.
Answer:
V(x) = x(45.7 – 2x) (30.5 – 2x)
V(x) = 4x3 – 152.4x2 + 1393. 85x
Eureka Math Algebra 2 Module 1 Lesson 17 Mathematical Modeling Exercise Answer Key
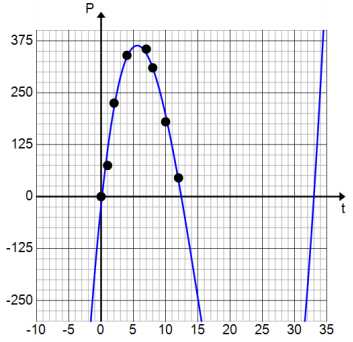
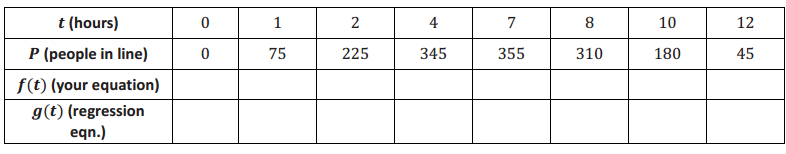
The owners of Dizzy Lizzy’s, an amusement park, are studying the wait time at their most popular roller coaster. The table below shows the number of people standing in line for the roller coaster t hours after Dizzy Lizzy’s opens.

Jaylon made a scatterplot and decided that a cubic function should be used to model the data. His scatterplot and curve are shown below.
Exercise 1.
Do you agree that a cubic polynomial function is a good model for this data? Explain.
Answer:
Yes, the curve passes through most of the points and seems to fit the data.
Exercise 2.
What information would Dizzy Lizzy’s be interested in learning about from this graph? How could they determine the answer?
Answer:
The company should be interested in the time when the line is the longest and how many people are in line at that time. To find this out, they can find a model that could be used to predict the number of people in line at any time during the day. They could then estimate the maximum point from the graph.
Exercise 3.
Estimate the time at which the line is the longest. Explain how you know.
Answer:
From the graph, the line is longest at 5.5 hours because the relative maximum of the function occurs at 5.5 hours.
Exercise 4.
Estimate the number of people in line at that time. Explain how you know.
Answer:
From the graph, there are roughly 372 people in line when t = 5.5; that is the approximate relative maximum value of P.
Exercise 5.
Estimate the t-intercepts of the function used to model this data.
Answer:
The t-intercepts are roughly 0, 12.5, and 33.
Exercise 6.
Use the t-intercepts to write a formula for the function of the number of people in line, f, after t hours.
Answer:
f(t) = ct(t – 12. 5) (t – 33), where c is a constant that has not yet been determined.
Exercise 7.
Use the relative maximum to find the leading coefficient off. Explain your reasoning.
Answer:
Since we have estimated f(5. 5) = 372, we can plug 5.5 into the function above, and we find that f(5. 5) 1058. 75c = 372. Solving for c, we find that c ≈ 0.35. The function that could model the data is then given by f(t) = 0. 35t(t – 12. 5) (t – 33).
Exercise 8.
What would be a reasonable domain for your function f? Why?
Answer:
A reasonable domain for f would be 0 ≤ x ≤ 12.5 because the opening of the park corresponds to t = 0, and after 12.5 hours the park closes, so there are no people waiting in line.
Exercise 9.
Use your function f to calculate the number of people In line 10 hours after the park opens.
Answer:
The formula developed In Exercise 7 gIves f(10) = 201. After the park has been open for 10 hours, there will be 201 people in line.
Exercise 10.
Comparing the value calculated above to the actual value in the table, is your function f an accurate model for the data? Explain.
Answer:
The value of the function differs from the value from the table by about 21 people, so it is not a perfect fit for the data, but it is otherwise very close. It appears to overestimate the number of people in line.
Exercise 11.
Use the regression feature of a graphing calculator to find a cubic function g to model the data.
Answer:
The calculator gives g(t) = 0. 43t3 – 17. 78t2 + 156. 63t – 24.16.
Exercise 12.
Graph the function f you found and the function g produced by the graphing calculator. Use the graphing calculator to complete the table. Round your answers to the nearest integer.
Answer:
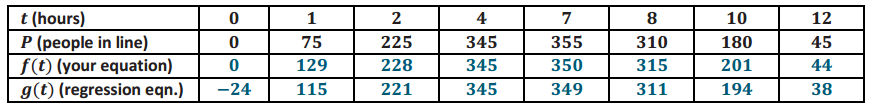
Exercise 13.
Based on the results from the table, which model was more accurate at t = 2 hours? t = 10 hours?
Answer:
At t = 2 hours, the function found by hand was more accurate. It was off by 3 people whereas the calculator function was off by 4 people. At t = 10 hours, the graphing calculator function was more accurate. It was off by 14 people whereas the function found by hand was off by 21 people.
Eureka Math Algebra 2 Module 1 Lesson 17 Problem Set Answer Key
Question 1.
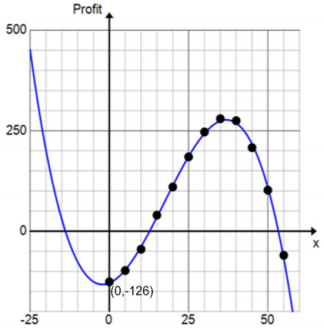
Recall the math club fund raiser from the Problem Set of the previous lesson. The club members would like to find a function to model their data, so Kylie draws a curve through the data points as shown.
a. What type of function does it appear that she has drawn?
Answer:
Degree 3 polynomial (or cubic polynomial)
b. The function that models the profit in terms of the number of t-shirts made has the form
P(x) = c(x3 – 53x2 – 236x + 9828). Use the vertical intercept labeled on the graph to find the value of the leading coefficient c.
Answer:
c ≈ – 0.01282,
so P(x) = – 0. 01282 (x3 – 53x2 – 236x + 9828)
c. From the graph, estimate the profit if the math club sells 30 t-shirts.
Answer:
The profit is approximately $250 if the club sells 30 t-shirts.
d. Use your function to estimate the profit if the math club sells 30 t-shirts.
Answer:
P(30) = 230.14. The equation predicts a profit of $230. 14.
e. Which estimate do you think is more reliable? Why?
Answer:
The estimate from the graph is probably more reliable because the equation required estimating the x-intercepts. If these estimates were off, it could have affected the equation.
Question 2.
A box is to be constructed so that it has a square base and no top.
a. Draw and label the sides of the box. Label the sides of the base as x and the height of the box as h.
Answer:
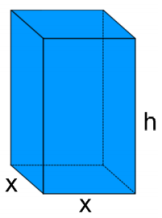
b. The surface area is 108 cm2. Write a formula for the surface area S, and then solve for h.
Answer:
S = x2 – 4xh = 108
h = \(\frac{108-x^{2}}{4 x}\)
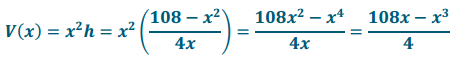
c. Write a formula for the function of the volume of the box in terms of x.
Answer:
d. Use a graphing utility to find the maximum volume of the box.
Answer:
108 cm3
e. What dimensions should the box be in order to maximize its volume?
Answer:
6cm × 6cm × 3cm
Eureka Math Algebra 2 Module 1 Lesson 17 Exit Ticket Answer Key
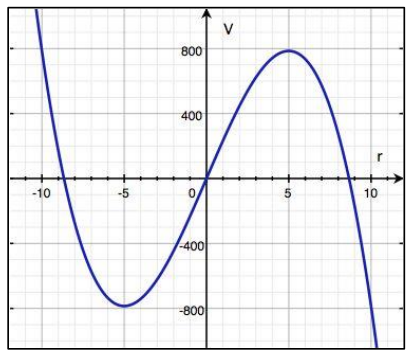
Jeannie wishes to construct a cylinder closed at both ends. The figure at right shows the graph of a cubic polynomial function, V, used to model the volume of the cylinder as a function of the radius if the cylinder is constructed using 150? cm3 of material. Use the graph to answer the questions below. Estimate values to the nearest half unit on the horizontal axis and to the nearest 50 units on the vertical axis.
Question 1.
What are the zeros of the function V?
Answer:
Approximately 0, – 8.5, and 8.5 (Students might round up to – 9 and 9.)
Question 2.
What is the relative maximum value of V and where does it occur?
Answer:
The relative maximum value is 800 cm3 at = 5 cm.
Question 3.
The equation of this function Is V(r) = c(r3 – 72. 25r) for some real number c. Find the value of c so that this formula fits the graph.
Answer:
Substituting r = 5 cm and V(r) = 800 cm3 and solving for c gives c ≈ – 3.4.
Question 4.
Use the graph to estimate the volume of the cylinder with r = 2 cm.
Answer:
Estimating from the graph, the volume of a cylinder of radius 2 cm is 450 cm3.
Question 5.
Use your formula for V to find the volume of the cylinder when r = 2 cm. How close is the value from the formula to the value on the graph?
Answer:
Using the formula: V(2) = – 3.4(23 – 72.25(2)) = 464.1. Therefore, the volume of the cylinder when r = 2 cm is 464.1 cm3. This value is close to the value of 450 cm3 found using the graph but not exact, particularly because we cannot read much detail from the graph.