Engage NY Eureka Math Algebra 2 Module 1 Lesson 14 Answer Key
Eureka Math Algebra 2 Module 1 Lesson 14 Example Answer Key
Example 1.
Graph each of the following polynomial functions. What are the function’s zeros (counting multiplicities)? What are the solutions to f(x) = 0? What are the x-intercepts to the graph of the function? How does the degree of the polynomial function compare to the x-intercepts of the graph of the function?
a. f(x) = x(x – 1) (x + 1)

Answer:
Zeros: – 1, 0, 1
Solutions to f(x) = 0: – 1, 0, 1
x-intercepts: – 1, 0, 1
The degree is 3, which is the same as the number of x-intercepts.
b. f(x) = (x + 3) (x + 3) (x + 3) (x + 3)
Answer:
Zeros: – 3, – 3, – 3, – 3 (repeated zero)
Solutions to f(x) = 0: – 3
x-intercept: – 3
The degree is 4, which is greater than the number of x-intercepts.
c. f(x) = (x – 1) (x – 2) (x + 3) (x + 4) (x + 4)
Answer:
Zeros: – 4, – 4, – 3, 1, 2
Solutions to f(x) = 0: – 4, – 3, 1, 2
x-intercepts: – 4, – 3, 1, 2
The degree is 5, which is greater than the number of x-intercepts.
d. f(x) = (x2 + 1) (x – 2) (x – 3)
Answer:
Zeros: 2, 3
Solutions to f(x) = 0: 2, 3
x-intercepts: 2, 3
The degree is 4, which is greater than the number of x-intercepts.
e. f(x) = (x – 2)2
Answer:
Zeros: 2, 2
Solutions to f(x) = 0: 2
x-intercepts: 2
The degree is 2, which is greater than the number of x-intercepts.
f. f(x) = (x – 1) (x + 1) (x – 2) (x + 2) (x – 3) (x + 3) (x – 4)
Answer:
Zeros: 1, – 1, 2, – 2, 3, – 3, 4
Solutions to f(x) = 0: 1,- 1, 2, – 2, 3, – 3, 4
x-intercepts: 1, – 1, 2, – 2, 3, – 3, 4
The degree is 7, which is equal to the number of x-intercepts.
g. f(x) = (x2 + 2)2
Answer:
Zeros: None
Solutions to f(x) = 0: No solutions
x-intercepts: No x-intercepts
The degree is 4, which is greater than the number of x-intercepts.
h. f(x) = (x + 1)2 (x – 1)2 x
Answer:
Zeros: – 1 – 11, 1, 0
Solutions to f(x) = 0: – 1, 0, 1
x-intercepts: – 1, 0, 1
The degree is 5, which is greater than the number of x-intercepts.
Example 2.
Consider the function f(x) = x3 – 13x2 + 44x – 32.
a. Use the fact that x – 4 is a factor of f to factor this polynomial.
Answer:
Using polynomial division and then factoring, f(x) = (x – 4) (x2 – 9x + 8) = (x – 4) (x – 8) (x – 1).
b. Find the x-intercepts for the graph of f.
Answer:
The x-intercepts are 1, 4, and 8.
c. At which x-values can the function change from being positive to negative or from negative to positive?
Answer:
0nly at the x-intercepts 1, 4, and 8.
d. To sketch a graph of f, we need to consider whether the function is positive or negative on the four intervals x < 1, 1 < x < 4, 4 < x < 8, and x > 8. Why is that?
Answer:
The function can only change sign at the x-intercepts; therefore, on each of those intervals, the graph will always be above or always be below the axis.
e. How can we tell if the function is positive or negative on an interval between x-intercepts?
Answer:
Evaluate the function at a single point in that interval. Since the function is either always positive or always negative between x-intercepts, checking a single point will indicate behavior on the entire interval.
f. For x < 1, is the graph above or below the x-axis? How can you tell?
Answer:
Since f(0) = – 32 is negative, the graph is below the x-axis for x < 1.
g. For 1 < x < 4, is the graph above or below the x-axis? How can you tell?
Answer:
Since f(2) = 12 is positive, the graph is above the x-axis for 1 < x < 4.
h. For 4 < x < 8, is the graph above or below the x-axis? How can you tell?
Answer:
Since f(5) = – 12 is negative, the graph is below the x-axis for 4 < x < 8. j. For x > 8, is the graph above or below the x-axis? How can you tell?
Answer:
Since f(10) = 108 is positive, the graph is above the x-axis for x > 8.
j. Use the information generated in parts (f) – (i) to sketch a graph of f.
Answer:
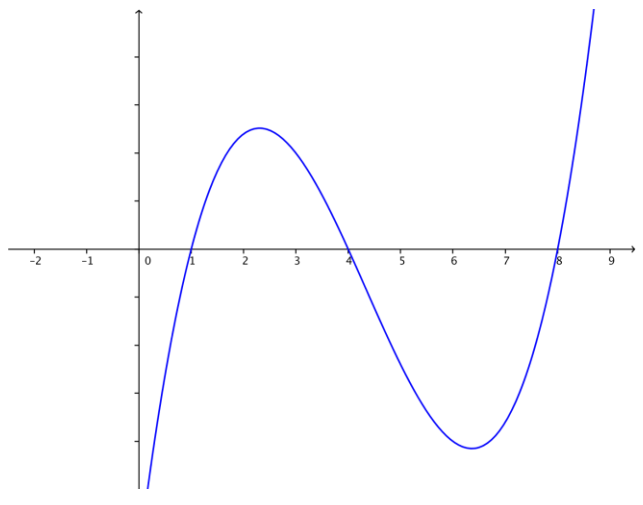
k. Graph y = f(x) on the interval from [0, 9] using a graphing utility, and compare your sketch with the graph generated by the graphing utility.
Answer:
Discussion
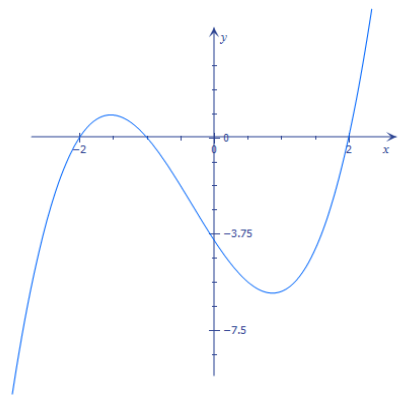
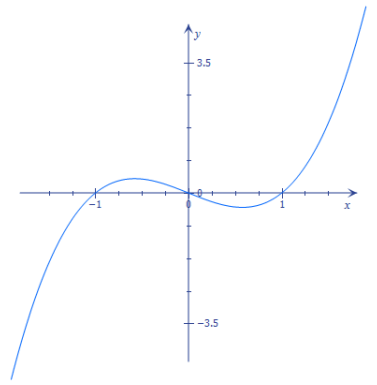
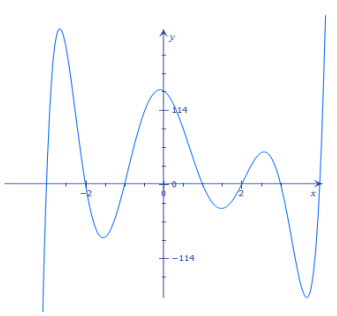
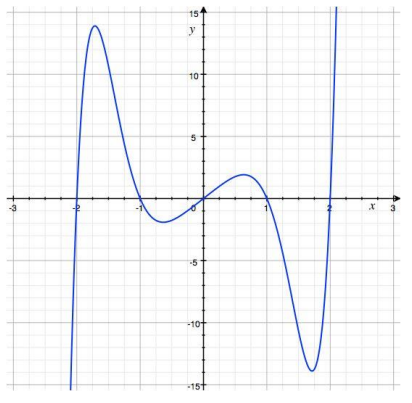
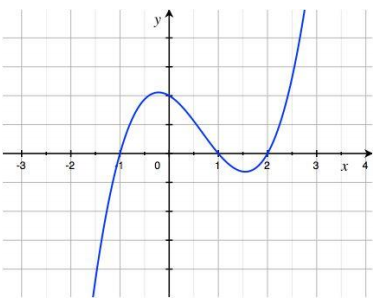
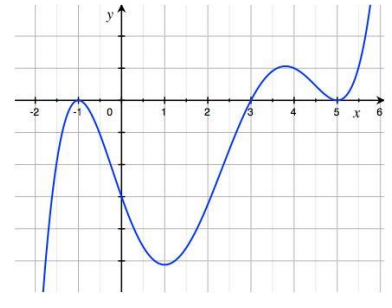
For any particular polynomial, can we determine how many relative maxima or minima there are? Consider the following polynomial functions in factored form and their graphs.
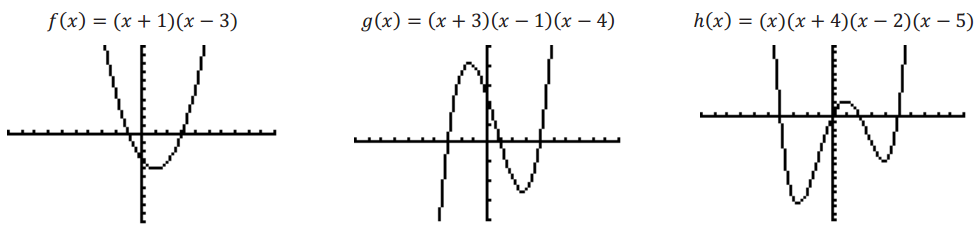
Degree of each polynomial:
Answer:
2 3 4
Number of x-intercepts in each graph:
Answer:
2 3 4
Number of relative maximum and minimum points shown in each graph:
Answer:
1 2 3
What observations can we make from this information?
Answer:
The number of relative maximum and minimum points is one less than the degree and one less than the number of x intercepts.
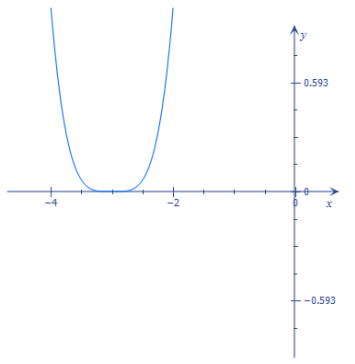
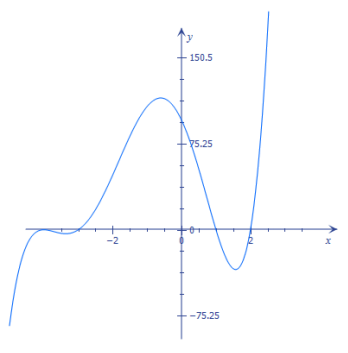
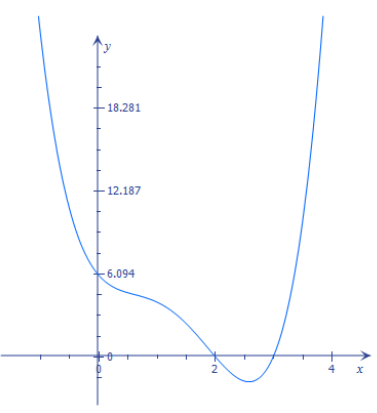
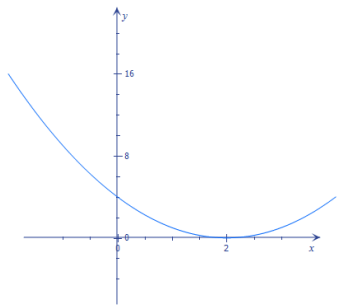
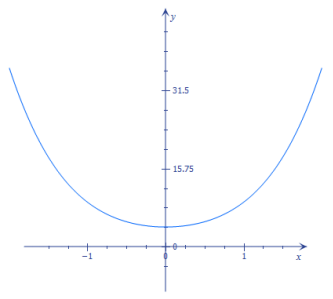
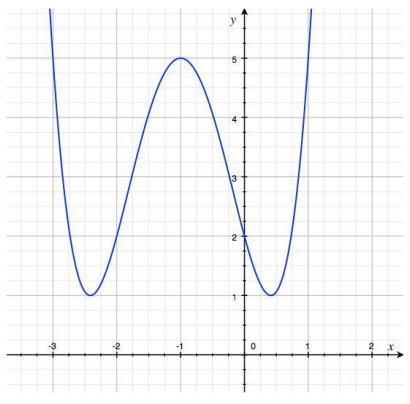
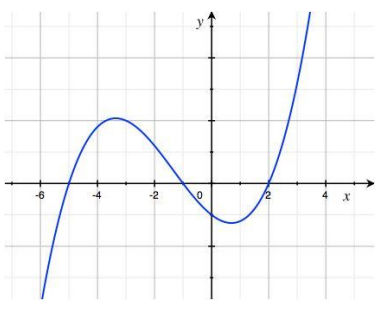
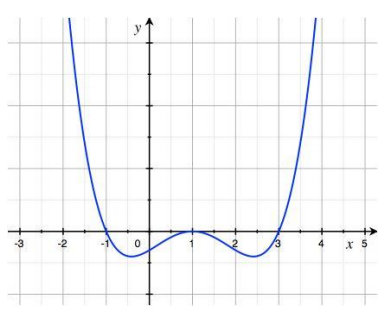
Is this true for every polynomial? Consider the examples below.
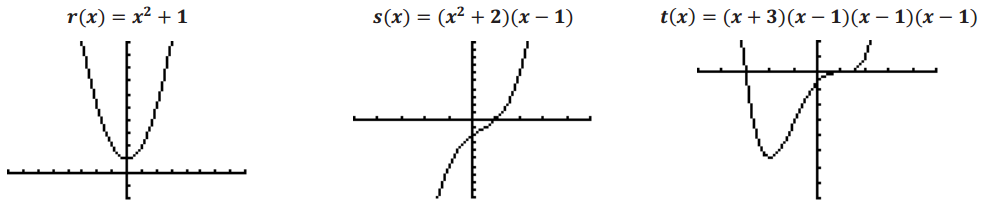
Degree of each polynomial:
Answer:
2 3 4
Number of x-intercepts in each graph:
Answer:
0 1 2
Number of relative maximum and minimum points shown in each graph:
Answer:
1 0 1
What observations can we make from this information?
Answer:
The observations made in the previous examples do not hold for these examples, so it is difficult to determine from the degree of the polynomial function the number of relative maximum and minimum points in the graph of the function. What we can say is that for a degree n polynomial function, there are at most n – 1 relative maxima and minima. You can also think about the information you can get from a graph. If a graph of a polynomial function has n relative maximum and minimum points, you can say that the degree of the polynomial is at least n + 1.
Eureka Math Algebra 2 Module 1 Lesson 14 Opening Exercise Answer Key
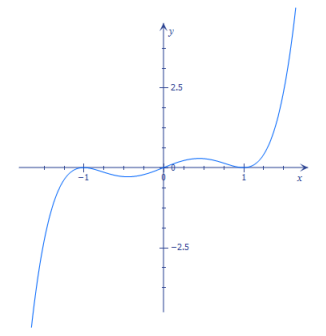
An engineer is designing a roller coaster for younger children and has tried some functions to
model the height of the roller coaster during the first 300 yards. She came up with the following function to describe what she believes would make a fun start to the ride:
H(x) = – 3x4 + 21x3 – 48x2 + 36x,
where H(x) is the height of the roller coaster (in yards) when the roller coaster is 100x yards
from the beginning of the ride. Answer the following questions to help determine at which distances from the beginning of the ride the roller coaster is at its lowest height.
a. Does this function describe a roller coaster that would be fun to ride? Explain.
Answer:
Yes, the roller coaster quickly goes to the top and then drops you down. This looks
like a fun ride.
No, I don’t like roller coasters that climb steeply, and this one goes nearly straight up.
b. Can you see any obvious x-values from the equation where the roller coaster is at height 0?
Answer:
The height is 0 when x is 0 because, at that value, each term is equal to 0.
c. Using a graphing utility, graph the function H on the interval 0 ≤ x ≤ 3, and identify when the roller coaster is 0 yards off the ground.
Answer:
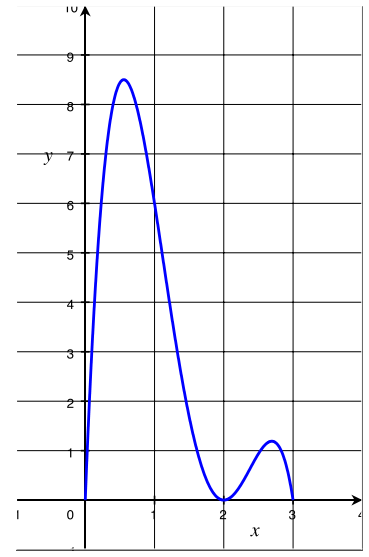
The lowest points of the graph on 0 ≤ x ≤ 3 are when the x-value satisfies H(x) = 0, which occurs when x is 0, 2, and 3.
d. What do the x-values you found in part (c) mean in terms of distance from the beginning of the ride?
Answer:
The distances represent 0 yards, 200 yards, and 300 yards, respectively.
e. Why do roller coasters always start with the largest hill first?
Answer:
So they can build up speed from gravity to help propel the cars through the rest of the track.
f. Verify your answers to part (c) by factoring the polynomial function H.
Answer:
Some students may need some hints or guidance with factoring.
H(x) = – 3x4 + 21x3 – 48x2 + 36x
= – 3x (x3 – 7x2 + 16x – 12)
From the graph, we suspect that (x – 3) is a factor; using long division, we obtain
H(x) = – 3x(x – 3)(x2 – 4x + 4)
= – 3x (x – 3) (x – 2) (x – 2)
= – 3x (x – 3) (x – 2)2.
The solutions to the equation H(x) = 0 are 0, 2, and 3. Therefore, the roller coaster is at the bottom at 0 yards, 200 yards, and 300 yards from the start of the ride.
g. How do you think the engineer came up with the function for this model?
Answer:
Let students discuss this question in groups or as a whole class. The following conclusion should be made:
To start at height 0 yards and end 300 yards later at height 0 yards, she multiplied x by x – 3 (to create zeros at 0 and 3). To create the bottom of the hill at 200 yards, she multiplied this function by (x – 2)2. She needed to multiply by – 3 to guarantee the roller coaster shape and to adjust the overall height of the roller coaster.
h. What is wrong with this roller coaster model at distance 0 yards and 300 yards? Why might this not initially bother the engineer when she is first designing the track?
Answer:
The model appears to abruptly start at 0 yards and abruptly end at 300 yards. In fact, the roller coaster looks as if it will crash into the ground at 300 yards! The engineer may be planning to “smooth” out the track later at 0 yards and 300 yards after she has selected the overall shape of the roller coaster.
Eureka Math Algebra 2 Module 1 Lesson 14 Problem Set Answer Key
Question 1.
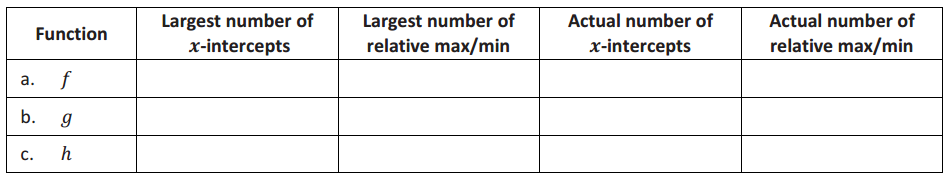
For each function below, identify the largest possible number of x-intercepts and the largest possible number of relative maxima and minima based on the degree of the polynomial. Then use a calculator or graphing utility to graph the function and find the actual number of x-intercepts and relative maxima and minima.
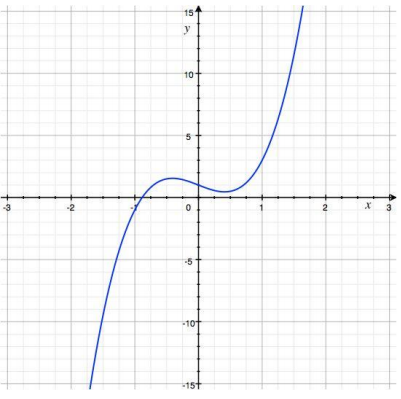
a. f(x) = 4x3 – 2x + 1
b. g(x) = x7 – 4x5 – x3 + 4x
c. h(x) = x4 + 4x3 + 2x2 – 4x + 2
Answer:
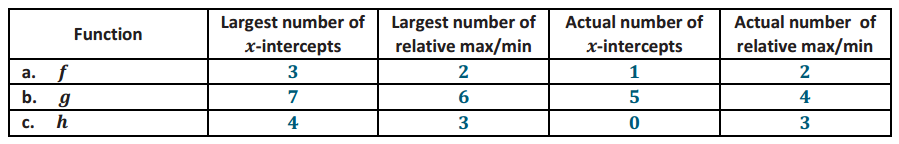
a. f(x) = 4x3 – 2x + 1
b. g(x) = x7 – 4x5 – x3 + 4x
c. h(x) = x4 + 4x3 + 2x2 – 4x + 2
Question 2.
Sketch a graph of the function f(x) = \(\frac{1}{2}\)(x + 5)(x + 1)(x – 2) by finding the zeros and determining the sign of the values of the function between zeros.
Answer:
The zeros are – 5, – 1, and 2.
For x < – 5: f(- 6) = – 20, so the graph is below the x-axis for x < – 5.
For – 5 < x < – 1: f(- 3) = 10, so the graph is above the x-axis for – 5 < x < – 1.
For – 1 < x < 2: f(0) = – 5, so the graph is below the x-axis for – 1 < x < 2. For x > 2: f(3) = 16, so the graph is above the x-axis for x > 2.
Question 3.
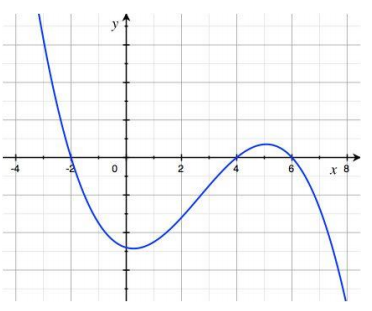
Sketch a graph of the function f(x) = – (x + 2) (x – 4) (x – 6) by finding the zeros and determining the sign of the values of the function between zeros.
Answer:
The zeros are – 2, 4, and 6.
For x < – 2: f(- 3) = 63, so the graph is above the x-axis for x < – 2.
For – 2 < x < 4: f(0) = – 48, so the graph is below the x-axis for – 2 < x < 4.
For 4 < x < 6: f(5) = 7, so the graph is above the x-axis for 4 < x < 6. For x > 6: f(7) = – 27, so the graph is below the x-axis for x > 6.
Question 4.
Sketch a graph of the function f(x) = x3 – 2x2 – x + 2 by finding the zeros and determining the sign of the values of the function between zeros.
Answer:
We can factor by grouping to find f(x) = (x2 – 1)(x – 2). The zeros are – 1, 1, and 2.
For x < – 1: f(- 2) = – 12, so the graph is below the x-axis for x < – 1.
For – 1 < x < 1: f(0) = 2, so the graph is above the x-axis for – 1 < x < 1.
For 1 < x < 2: f\(\left(\frac{3}{2}\right)\) = – \(\frac{5}{8}\), so the graph is below the x-axis for 1 < x < 2. For x > 2: f(3) = 8, so the graph is above the x-axis for x > 2.
Question 5.
Sketch a graph of the function f(x) = x4 – 4x3 + 2x2 + 4x – 3 by determining the sign of the values of the function between the zeros – 1, 1, and 3.
Answer:
We are told that the zeros are – 1, 1, and 3.
For x < – 1: f(- 2) = 45, so the graph is above the x-axis for x < – 1.
For – 1 < x < 1: f(0) = – 3, so the graph is below the x-axis for – 1 < x < 1.
For 1 < x < 3: f(2) = – 3, so the graph is below the x-axis for 1 < x < 3. For x > 3:
f(4) = 45, so the graph is above the x-axis for x > 3.
Question 6.
A function f has zeros at -1, 3, and 5. We know that f(- 2) and f(2) are negative, while f(4) and f(6) are positive. Sketch a graph of f.
Answer:
From the information given, the graph of f lies below the x-axis for x < – 1 and – 1 < x < 3 and that it touches the x-axis at -1. Similarly, we know that the graph off lies above the x-axis for 3 < x < 5 and 5 < x and that it touches the x-axis at 5. We also know that the graph crosses the x-axis at 3.
Question 7.
The function h(t) = – 16t2 + 33t + 45 represents the height of a ball tossed upward from the roof of a building 45 feet in the air after t seconds. Without graphing, determine when the ball will hit the ground.
Answer:
Factor: h(t) = (t – 3) (- 16t – 15)
Solve h(t) = 0: (t – 3)(-16t – 15) = 0
t = 3 seconds or t = –\(\frac{15}{16}\) seconds.
The ball hits the ground at time 3 seconds; the solution –\(\frac{15}{16}\) does not make sense ¡n the context of the problem.
Eureka Math Algebra 2 Module 1 Lesson 14 Exit Ticket Answer Key
Sketch a graph of the function f(x) = x3 + x2 – 4x – 4 by finding the zeros and determining the sign of the function between zeros. Explain how the structure of the equation helps guide your sketch.
Answer:
f(x) = (x + 1)(x + 2)(x – 2)
Zeros: – 1, – 2, 2
For x < – 2: f(-3) = -10, so the graph is below the x-axis on this interval.
For – 2 < x < – 1: f(- 1.5) = 0. 875, so the graph is above the x-axis on this interval.
For – 1 < x < 2: f(0) = -4, so the graph is below the x-axis on this interval. For x > 2: f(3) = 20, so the graph is above the x-axis on this interval.