Engage NY Eureka Math Algebra 1 Module 5 Lesson 7 Answer Key
Eureka Math Algebra 1 Module 5 Lesson 7 Exercise Answer Key
Opening Exercise
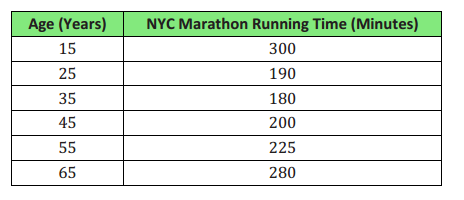
What is this data table telling us?
Answer:
The relationship between the age of runners in the NYC Marathon and their running time.
Exercises
Exercise 1.
Use the following data table to construct a regression model, and then answer the questions.
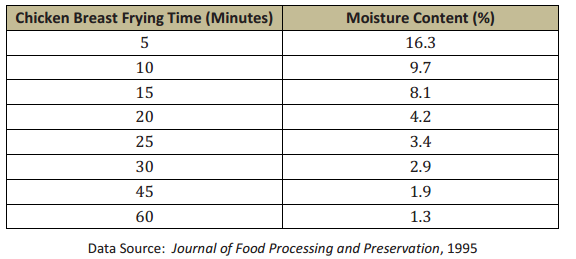
a. What function type appears to be the best fit for this data? Explain how you know.
Answer:
The relationship between frying time and moisture content is best modeled by an exponential regression. Using the calculator yields the function f(x) = 13.895(0.957)x with a coefficient of determination of approximately 0.904. (r = -0.95077…, so r2 = 0.9039 ….)
b. A student chooses a quadratic regression to model this data. Is he right or wrong? Why or why not?
Answer:
This data cannot be modeled by a quadratic regression because as cooking time increases, moisture content will always decrease and never begin to increase again. Also, in looking at the longer-term trend, we see that for a quadratic model the values are decreasing initially but will eventually begin to increase. This makes the quadratic model less reliable for larger x-values.
c. Will the moisture content for this product ever reach 0%? Why or why not?
Answer:
The moisture content will never reach 0% because exponential decay functions get smaller and smaller but never disappear entirely.
d. Based on this model, what would you expect the moisture content to be of a chicken breast fried for 50 minutes?
Answer:
f(50) = 13.895(0.95750) = 1.5
The expected moisture content for a chicken breast fried for 50 minutes would be 1.5%.
Exercise 2.
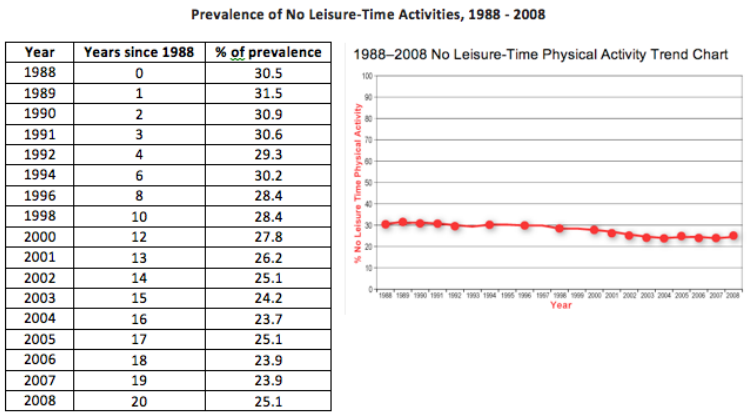
Use the following data table to construct a regression model, then answer the questions based on your model.
Answer:
Using technology to find a linear regression model, we find that the best-fit line is y = -0.3988x + 31.517, with a correlation coefficient of -0.952.
a. What trends do you see in this collection of data?
Answer:
The data seem to be dropping gradually over the years but at a fairly constant, though small, negative rate. The correlation coefficient of nearly -1 indicates that this model has a strong negative linear relationship.
b. How do you interpret this trend?
Answer:
The rate of leisure-time physical activity in the U.S. has slowly declined over the years since 1988 and is likely to continue to do so.
c. If the trend continues, what would we expect the percentage of people in the U.S. who report no leisure-time physical activity to be in 2020?
Answer:
The year 2020 is year 32, since 1988, so f(32) = -0.3988(32) + 31.517 = 18.755. So, if this trend continues, we would expect about 19% of the population to report no leisure-time physical activity in 2020.
Eureka Math Algebra 1 Module 5 Lesson 7 Problem Set Answer Key
Question 1.
Use the following data tables to write a regression model, and then answer the questions:
Prescription Drug Sales in the United States Since 1995
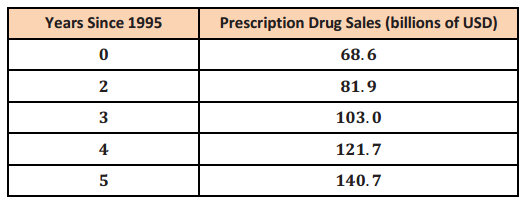
a. What is the best model for this data?
Answer:
The best model for this data would be an exponential regression, given by the function f(t) = 65.736(1.161)t with a correlation coefficient of 0.987 and a correlation of determination of 0.975.
b. Based on your model, what were prescription drug sales in 2002? 2005?
Answer:
2002: f(7) = 186.9, and 2005: f(10) = 292.5
c. For this model, would it make sense to input negative values for t into your regression? Why or why not?
Answer:
Because there were prescription drug sales in the years prior to 1995, it would make sense to use negative numbers with this model (unless some drastic change in drug sales in 1995 makes this model inaccurate for preceding years).
Question 2.
Use the data below to answer the questions that follow:
Per Capita Ready-to-Eat Cereal Consumption in the United States per Year Since 1980
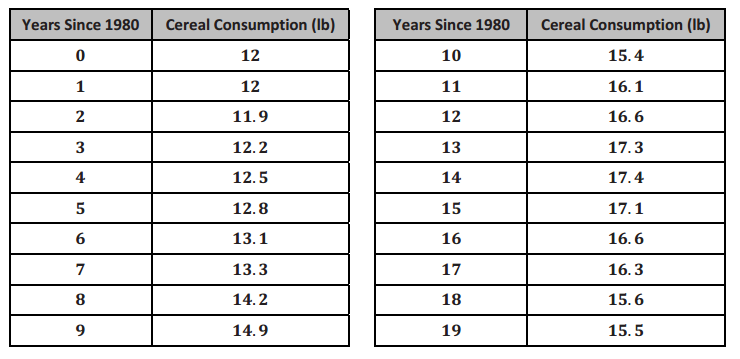
a. What is the best model for this data?
Answer:
The best regression fit here is the quadratic f(t) = -0.018t2 + 0.637t + 10.797 with correlation coefficient of 0.92 and a coefficient of determination (r2) of 0.85.
b. Based on your model, what would you expect per capita cereal consumption to be in 2002? 2005?
Answer:
According to the model, f(22) = 16.1, and f(25) = 15.5.
Based on the model, the expected per capita cereal consumption in 2002 would be 16.1 lb. In 2005, it would be 15.5 lb.
(Note: Because this model has a little lower coefficient of determination (0.85), these predictions may not seem to fit well with the given data table.)
c. For this model, will it make sense to input t-values that return negative output values? Why or why not?
Answer:
No. Negative output values for this model would correspond to negative pounds of cereal consumed, which is impossible. Therefore, this model would only be useful over the domain where f is positive.
Eureka Math Algebra 1 Module 5 Lesson 7 Exit Ticket Answer Key
Question 1.
Use the following data table to construct a regression model, and then answer the questions.
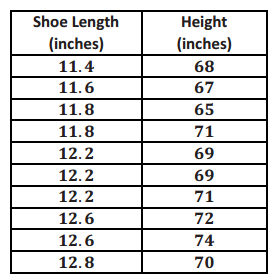
a. What is the best regression model for the data?
Answer:
The best model for regression here is linear, modeled using the calculator as f(x) = 3.657x + 25.277 with a correlation coefficient of 0.6547.
b. Based on your regression model, what height would you expect a person with a shoe length of 13.4 inches to be?
Answer:
f(13.4) = 74 → a person with shoes 13.4 inches long might be 74 inches tall.
c. Interpret the value of your correlation coefficient in the context of the problem.
Answer:
Based on the correlation coefficient, there is a moderate positive linear relationship between shoe length and height.