Engage NY Eureka Math Algebra 1 Module 5 Lesson 6 Answer Key
Eureka Math Algebra 1 Module 5 Lesson 6 Example Answer Key
Example 1.
Enrique is a biologist who has been monitoring the population of a rare fish in Lake Placid. He has tracked the population for 5 years and has come up with the following estimates:
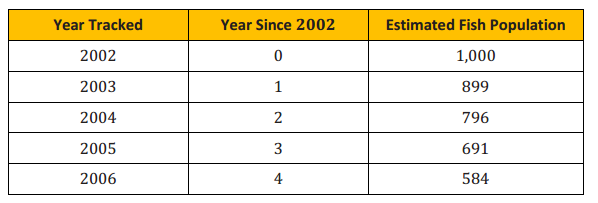
Create a graph and a function to model this situation, and use it to predict (assuming the trend continues) when the fish population will be gone from the Lake Placid ecosystem. Verify your results, and explain the limitations of each model.
Answer:
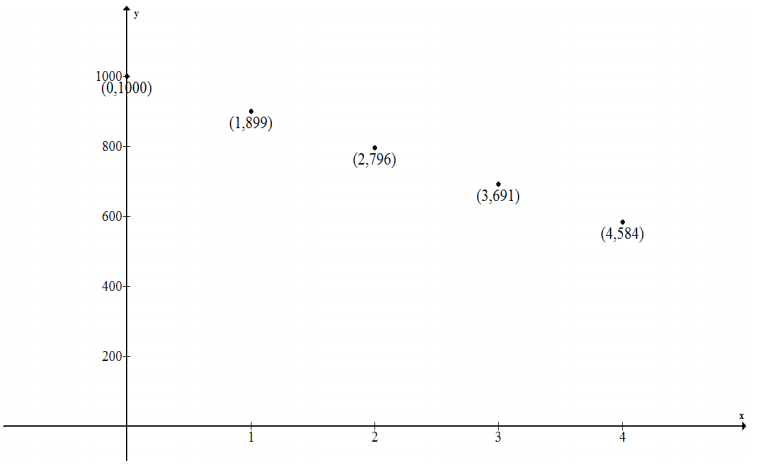
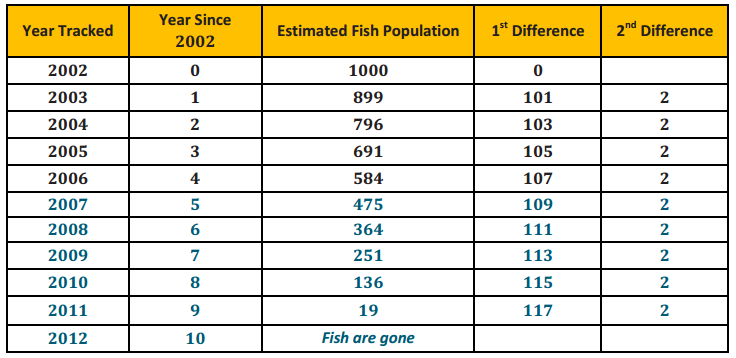
When we plot this data in a reasonable viewing window, the data appear to be linear. One limitation of using a graph is that it is difficult to get a viewing window that allows us to see all of the key features of the function represented. When we look at the first differences, we can see that this is not a linear relationship. To determine when the fish population will be gone, we need to find the function to model this situation.

Answer:
Looking at differences may help us identify the function type. The first differences are 101, 103, 105, 107, and so on. These are not the same but are at regular intervals. That tells us that there will be a common second difference, in this case 2. This data can be modeled with a quadratic function.
Creating a symbolic representation:
The standard form for a quadratic function is f(x) = ax2 + bx + c.
We know that (0,1000) is the y – intercept. That tells us c = 1000. Now we have f(x) = ax2 + bx + 1000.
Substitute (1,899): 899 = a + b + 1000→a + b = – 101
Substitute (2,796): 796 = 4a + 2b + 1000→4a + 2b = – 204
Now solve the linear system:
202 = – 2a – 2b
– 204 = 4a + 2b
– 2 = 2a → a = – 1
Now solve for b: – 1 + b = – 101 → b = – 100
The function model is f(x) = – x2 – 100x + 1000.
So, now we need to determine when the fish population will be 0.
Solve 0 = – x2 – 100x + 1000.
Using the quadratic formula: x = \(\frac{100 \pm \sqrt{( – 100)^{2} – 4( – 1)(1000)}}{2( – 1)}\) ≈ – 109.16 or 9.16
Since only the positive number of years is reasonable in this situation, we will say that x = 9.16 years after 2002.
Depending on whether the initial measurement is taken at the beginning of 2002 or at the end, we could say that the fish population will be gone during 2011 or that it will be gone by 2012.
The function model has fewer limitations than the graph, but it provides results that need to be interpreted in the context of the problem.
Eureka Math Algebra 1 Module 5 Lesson 6 Exercise Answer Key
Opening Exercise
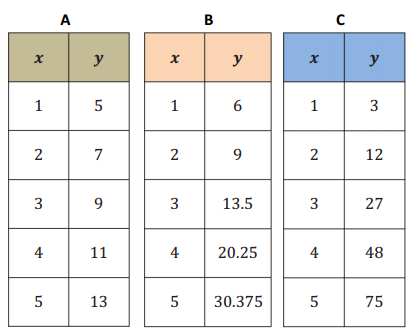
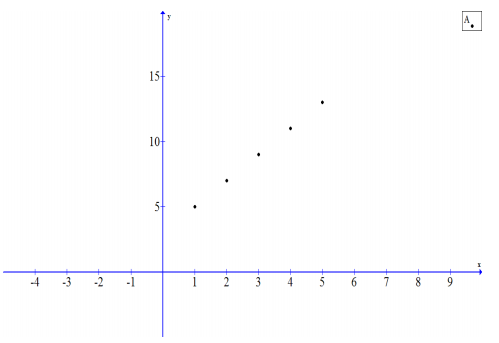
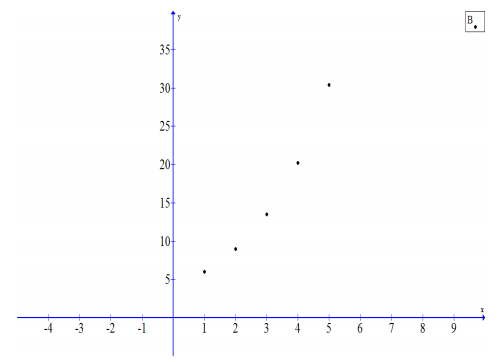
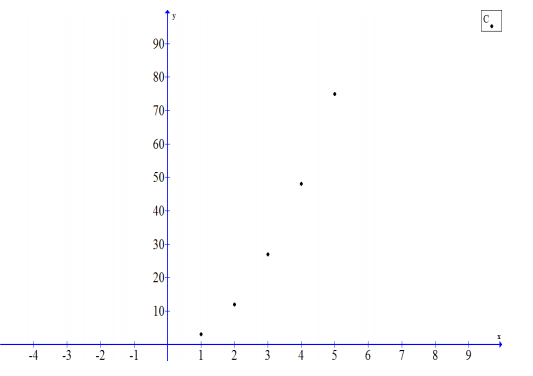
a. Identify the type of function that each table appears to represent (e.g., quadratic, linear, exponential, square root).
Answer:
A: Linear
B: Exponential
C: Quadratic
b. Explain how you were able to identify the function.
Answer:
I looked at the difference in each output.
A is constant so that it is linear (common difference is 2),
B is a geometric sequence (common ratio is 1.5), and for
C the difference of the differences is the same number (6), so it is quadratic.
c. Find the symbolic representation of the function.
Answer:
A: f(x) = 2x + 3
B: f(x) = 4(1.5x)
C: f(x) = 3x2
d. Plot the graphs of your data.

Answer:
Exercises
Exercise 1.
Bella is a BMX bike racer and wants to identify the relationship between her bike’s weight and the height of jumps (a category she gets judged on when racing). On a practice course, she tests out 7 bike models with different weights and comes up with the following data.
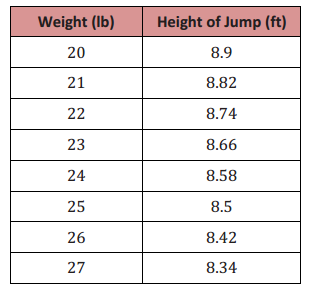
a. Bella is sponsored by Twilight Bikes and must ride a 32 lb. bike. What can she expect her jump height to be?
Answer:
By looking at the differences between the terms, we can identify that this is a linear relationship (or an arithmetic sequence) that decreases by 0.08 for every 1 lb. increase in weight.
8.9 = a0 – 0.08(20) → 8.9 = a0 – 1.6 → a0 = 10.5
h(w) = 10.5 – 0.08w
h(32) = 10.5 – 0.08(32) = 7.94
For a 32 lb. bike, her expected jump height would be 7.94 ft.
b. Bella asks the bike engineers at Twilight to make the lightest bike possible. They tell her the lightest functional bike they could make is 10 lb. Based on this data, what is the highest she should expect to jump if she only uses Twilight bikes?
Answer:
h(w) = 10.5 – 0.08w
h(10) = 10.5 – 0.08(10) = 9.7
If she uses the Twilight bike, her expected jump height would be 9.7 ft.
c. What is the maximum weight of a bike if Bella’s jumps have to be at least 2 ft. high during a race?
Answer:
h(w) = 10.5 – 0.08w
2 = 10.5 – 0.08(w) → w = 106.25
The maximum bike weight would be 106.25 lb. in order to jump at least 2 ft.
Exercise 2.
The concentration of medicine in a patient’s blood as time passes is recorded in the table below.
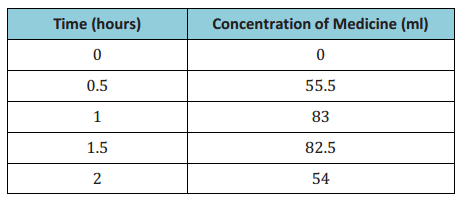
a. The patient cannot be active while the medicine is in his blood. How long, to the nearest minute, must the patient remain inactive? What are the limitations of your model(s)?
Answer:
If we plot the points, we can see a general shape for the graph.
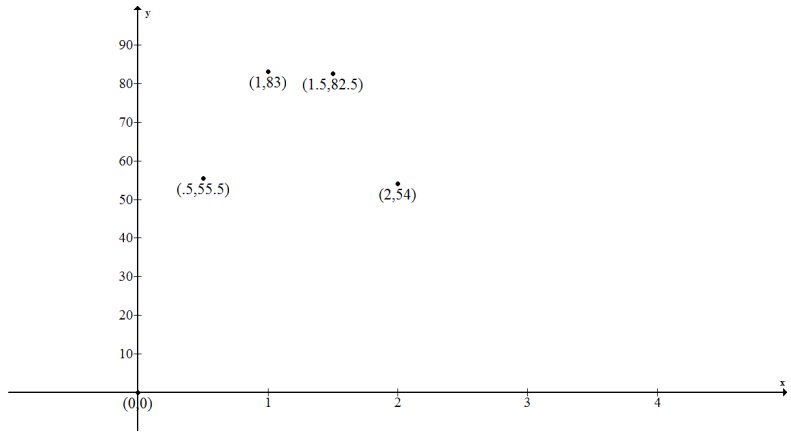
This might be a quadratic relationship, but we cannot be sure based on just the graph. If we look at the differences, we see that the first differences are 55.5, 27.5, – 0.5, and – 28.5. Then, the second differences are consistently – 28. Yes, this is a quadratic relationship.
Since we know (0,0) is on the graph, the constant of the quadratic function is 0. Now we can use a system of two linear equations to find the symbolic representation:
M(t) = at2 + bt + 0
Substituting (0.5,55.5) → 55.5 = 0.25a + 0.5b
→ 222 = a + 2b (Multiply both sides by 4 to eliminate the decimals.)
Substituting (1,83) → 83 = a + b
a + 2b = 222
– a – b = – 83
b = 139)
so, a + 139 = 83 → a = – 56
M(t) = – 56t2 + 139t
We set the function equal to zero and find the other zero of the function to be x = 0 or 2.48 hours. For this context, 2.48 hours makes sense. In hours and minutes, the patient must remain inactive for 2 hours and 29 minutes.
The function is a good model to use for answering this question since the graph requires some speculation and estimation.
Alternatively, students may generate a model by estimating the location of the vertex at about (1.25,84), and then using the vertex form of a quadratic equation. Using this method results in an equation of approximately f(x) = – 50(x – 1.25)2 + 84. A useful extension activity could be to compare these two methods and models.
b. What is the highest concentration of medicine in the patient’s blood?
Answer:
Using the symmetry of the zeros of the function, we find the vertex to be at the midpoint between them or at (1.24,86.25). So the highest concentration will be 86.25 ml.
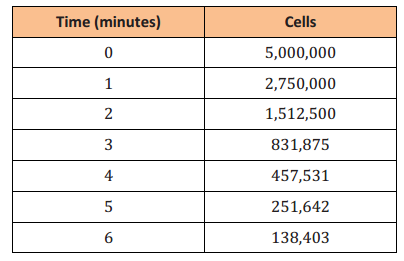
Exercise 3.
A student is conducting an experiment, and as time passes, the number of cells in the experiment decreases. How many cells will there be after 16 minutes?
Answer:
If we divide each term by the one before it, we see that this is a geometric sequence where the rate is 0.55 and the initial value is 5,000,000. Therefore, we can represent this sequence symbolically by
c(m) = 5 000 000(0.55)m.
c(16) = 5 000 000(0.55)16 → c(16) = 350.57
After 16 minutes, there will be approximately 351 cells.
Eureka Math Algebra 1 Module 5 Lesson 6 Problem Set Answer Key
Question 1.
Research linear, quadratic, and exponential functions using the Internet. For each of the three types of functions, provide an example of a problem/situation you found on the Internet where that function was used to model the situation or answer the problem. Include the actual function used in the example and web page where you found the example.
Answer:
Answers will vary.
Eureka Math Algebra 1 Module 5 Lesson 6 Exit Ticket Answer Key
Lewis’s dad put $1,000 in a money market fund with a fixed interest rate when he was 16. Lewis cannot touch the money until he is 26, but he gets updates on the balance of his account.
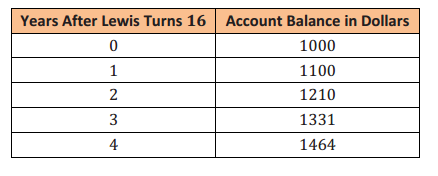
a. Develop a model for this situation.
Answer:
We might try graphing this data. However, in the viewing window that shows our data points (see graph below), it appears that the function might be linear. Let’s try zooming out to see more of the key features of this graph. (See graph below.)
x: [0,5] y: [975,1500]
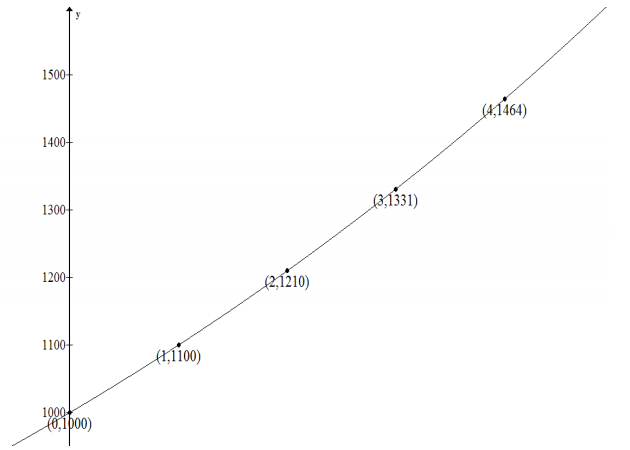
This viewing window gives us a close – up of the data points and their relation to each other. However, we cannot really see the features of the graph that represent the data.
x: [ – 25,25] y: [0,9700]
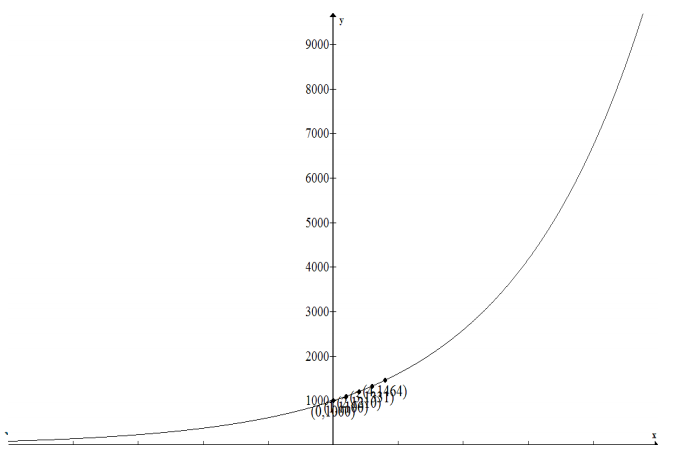
In this version of the graph, you can see how the data from our table is grouped on a very short section of the graph. From this view, we can see the exponential nature of the graph.
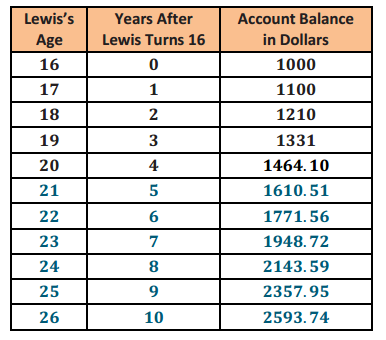
Using the data table to find a function model: The first and second differences have no commonalities; therefore, this is not linear or quadratic. Checking to see if there is a common ratio, we see that this is an exponential relationship (or a geometric sequence) where the common ratio is 1.1, and the initial value is 1000. Check: Since on this table time starts at t = 0, using t as the exponent will yield $1,000 for the initial balance.
Therefore, we can represent this sequence symbolically by A(t) = 1000(1.1)t
b. Use your model to determine how much Lewis will have when he turns 26 years old.
Answer:
Using the function: Since Lewis will be 26 ten years after he turns 16, we will need to evaluate A(10):
A(10) = 1000(1.1)10 → A(10) = 2593.74 or $2,593.74.
We might also try extending our data table to verify this result. There are a couple of precision decisions to make: Shall we use 1.1 as the common ratio? How soon should we begin rounding numbers off? For this table, we decided to use 1.1 as the common ratio and rounded to the nearest cent.
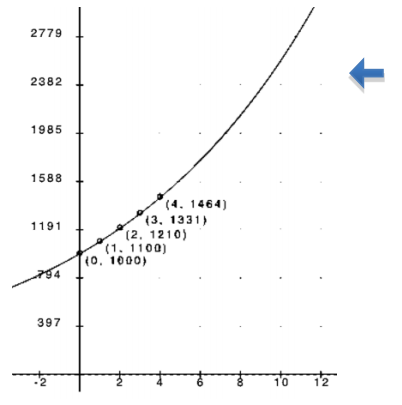
We might also try to answer this question using our graph. Below is another view of the graph. Can you estimate the balance at t = 10?
c. Comment on the limitations/validity of your model.
Answer:
As we saw in the first and second versions of the graph, there are limitations to the graphic model because we cannot always see the key features of the graph in a window that lets us see all the data points clearly. Being able to see the graph using both windows was more helpful. Then, in part (b), we saw how difficult it was to estimate the value of A(10). We were also able to extend the table without too much difficulty, after deciding what level of precision we needed to use.
The equation was most helpful but requires interpretation of the data (noticing that the common ratio was very close but not absolutely perfect, and making sure we started with t = 0).
Regardless of whether we use a graphical, numerical, or algebraic model, one limitation is that we are assuming the growth rate will remain constant until he is 26.