Engage NY Eureka Math Algebra 1 Module 5 Lesson 2 Answer Key
Eureka Math Algebra 1 Module 5 Lesson 2 Example Answer Key
Example 1.
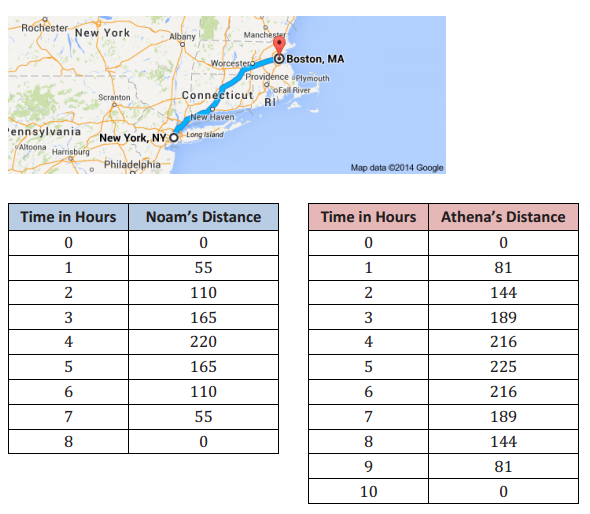
Noam and Athena had an argument about whether it would take longer to get from NYC to Boston and back by car or by train. To settle their differences, they made separate, nonstop round trips from NYC to Boston. On the trip, at the end of each hour, both recorded the number of miles they had traveled from their starting points in NYC. The tables below show their travel times, in hours, and the distances from their starting points, in miles. The first table shows Noam’s travel time and distance from the starting point, and the second represents Athena’s. Use both data sets to justify your answers to the questions below.
a. Who do you think is driving, and who is riding the train? Explain your answer in the context of the problem.
Answer:
This is an open – ended question with no right or wrong answer. Check for mathematically sound reasoning based on the data.
Sample Response: It appears that Athena is riding the train since she was able to go 81 miles in the first hour, and Noam was able to go only 55, which is a typical highway speed. Also, Athena made the round trip in 10 hours, while Noam made it in 8, so it looks like the train may have had to stop at stations when it was near Boston, slowing its progress considerably during the 2 hours when the train was outside of Boston.
b. According to the data, how far apart are Boston and New York City? Explain mathematically.
Answer:
This is an open – ended question with no right or wrong answer. Check for mathematically sound reasoning based on the data.
Sample Response: Based on the symmetry of the values in the table, Noam’s maximum distance was 220 miles (at 4 hours). Using the same symmetry, Athena’s maximum distance was 225 miles. They may have started or ended at different places, but it is more likely that the route for the train was slightly different from that of the car.
c. How long did it take each of them to make the round trip?
Answer:
Let’s call Noam’s distance N and Athena’s distance A. Noam was traveling for 8 hours and Athena for 10 hours. The zeros for N are (0,0) and (8,0) and for A are (0,0) and (10,0). It took Noam 8 hours; it took Athena 10 hours.
d. According to their collected data, which method of travel was faster?
Answer:
If we assume that Noam was traveling by car, then the car was faster by 2 hours, overall. However, the speed of the train was faster for the first and the last hour and then slowed.
e. What was the average rate of change for Athena for the interval from 3 to 4 hours? How might you explain that in the context of the problem?
Answer:
She only traveled 27 miles per hour: \(\frac{216 – 189}{4 – 3}\). Since she was likely on the train, there may have been stops during that time period.
f. Noam believes a quadratic function can be used as a model for both data sets. Do you agree? Use and describe the key features of the functions represented by the data sets to support your answer.
Answer:
The two data sets have several things in common. Both are symmetric, both have a vertex, and both have (0,0) as one of the x – intercepts and the y – intercept. The other x – intercept is (8,0) for Noam and (10,0) for Athena. However, Noam’s data set has a positive constant difference of + 55 on one side of the vertex, which then changes to – 55 on the other side. Noam’s data set can be best modeled by an absolute value or other piecewise function. Athena’s data does not have a constant first difference, so it is not linear. When we check the second differences, we find it to be constant ( – 18). Therefore, Athena’s trip can be modeled with a quadratic function.
Eureka Math Algebra 1 Module 5 Lesson 2 Exercise Answer Key
Opening Exercise
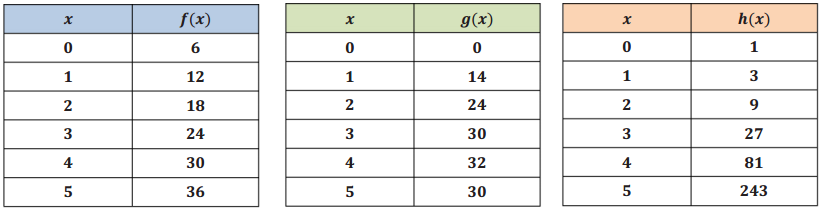
When tables are used to model functions, we typically have just a few sample values of the function and therefore have to do some detective work to figure out what the function might be. Look at these three tables:
Answer:
→ What do you notice about the three sets of data? Can you identify the type of function they represent?
Students may observe some of the examples listed below. It is also possible that they will not notice much of anything, or they may have ideas that are incorrect. Just let them brainstorm, and then come back to their ideas later to see how many were helpful.
→ The orange set is growing much faster than the first two. Many of the function values in the blue and green are the same. It is difficult to know the function by looking at only these numbers for the first two. However, I notice that the function values in the green set were growing steadily and then decreased at the end. It might help if we had more data points.
→ Have students make conjectures about the type of function they believe each data set represents and support their conjectures with evidence, which might include a graph.
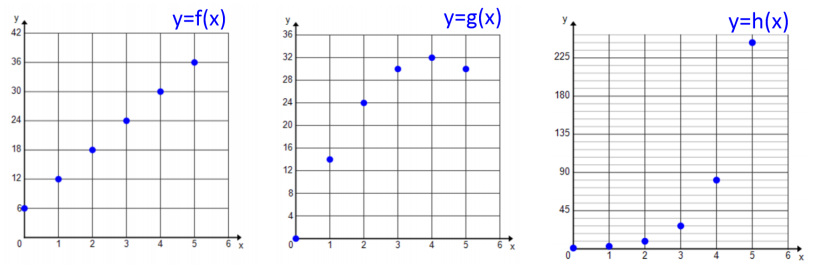
Now show a data plot for each:
→ Now can you see the trends more clearly?
→ Yes, it is obvious that the first is linear. It is clearer that the second is quadratic. And the third looks to be exponential.
→ We learned to determine the type of function by looking at the shapes of graphs. Can we also determine the type of function by just using its table of values? Analyze each table and find any special patterns that may help determine the type of function it represents.
→ The table of values for the linear function has a constant first difference of 6, indicating the graph will have a slope of 6. The quadratic function does not have a constant difference like a linear function. However, the difference of differences (second difference) is constant. The exponential function does not have constant first or second differences. However, the y – value is multiplied by a constant value of 3. It should be noted that the x – values are all increasing by one. Not all data are presented where the x – values are increasing by a constant value, so it is necessary to interpolate values to produce equal – sized intervals.
Exercises
Exercise 1.
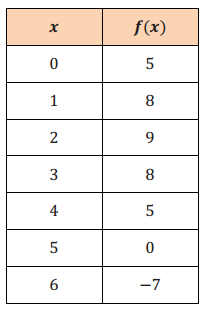
Explain why each function can or cannot be used to model the given data set.
a. f(x) = 3x + 5
Answer:
This function cannot be used to model the data set. The y – intercept is 5, but the first difference is not constant, and the data set is not a linear function.
b. f(x) = – (x – 2)2 + 9
Answer:
This function can be used to model the data set. The second difference has a constant value of – 2; therefore, it is a quadratic function. The vertex is (2,9), and it is a maximum since the leading coefficient is negative.
c. f(x) = – x2 + 4x –5
Answer:
This function cannot be used to model the data set. The y – intercept for this equation is – 5 instead of 5.
d. f(x) = 3x + 4
Answer:
This function cannot be use used to model the data set. The y – intercept is 5, and f(x) values are not being multiplied by a constant value. It is not an exponential function.
e. f(x) = (x – 2)2 + 9
Answer:
This function cannot be used to model the data set. The vertex is (2,9); however, it is a minimum in this function.
f. f(x) = – (x + 1)(x – 5)
Answer:
This function can be used to model the data set. One of the x – intercepts is x = 5, and the second x – intercept is x = – 1 by following the pattern of the data. The function equation indicates x – intercepts of – 1 and 5, where the vertex is a maximum value of the function.
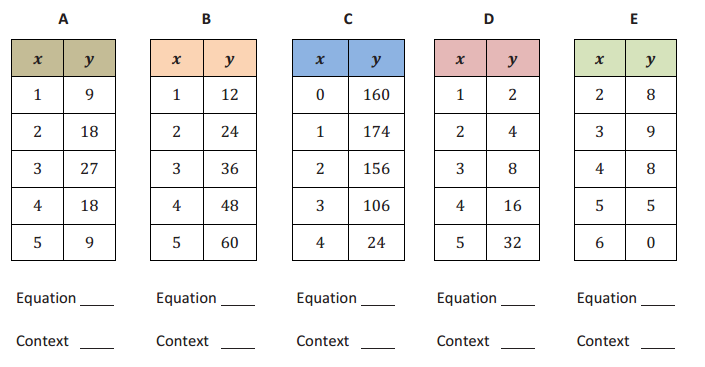
Exercise 2.
Match each table below to the function and the context, and explain how you made your decision.
Answer:
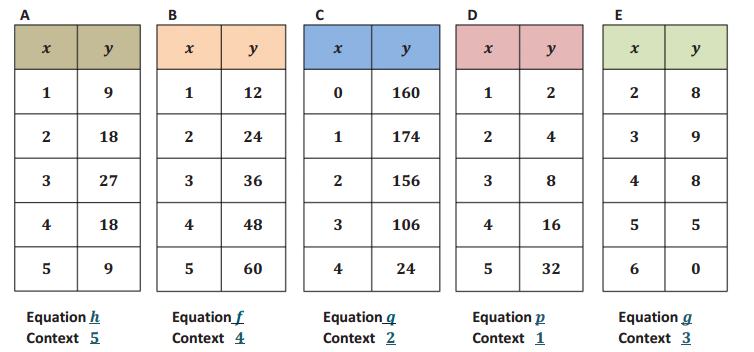
Equations:
f(x) = 12x
h(x) = – 9|x – 3| + 27
g(x) = – (x)(x – 6)
p(x) = 2x
q(x) = – 16x2 + 30x + 160
Contexts:
1. The population of bacteria doubled every month, and the total population vs. time was recorded.
2. A ball was launched upward from the top of a building, and the vertical distance of the ball from the ground vs. time was recorded.
3. The height of a certain animal’s vertical leap was recorded at regular time intervals of one second; the animal returned to ground level after six seconds.
4. Melvin saves the same amount of money every month. The total amount saved after each month was recorded.
5. Chris ran at a constant rate on a straight – line path and then returned at the same rate. His distance from his starting point was recorded at regular time intervals.
Eureka Math Algebra 1 Module 5 Lesson 2 Problem Set Answer Key
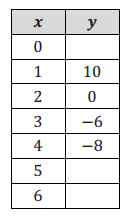
Question 1.
Answer:
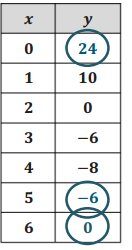
a. Determine the function type that could be used to model the data set at the right, and explain why.
Answer:
Quadratic—the second difference is 4.
b. Complete the data set using the special pattern of the function you described in part (a).
Answer:
See the completed table for answers.
c. If it exists, find the minimum or maximum value for the function model. If there is no minimum or maximum, explain why.
Answer:
Minimum value occurs at (4, – 8).
Question 2.
Answer:
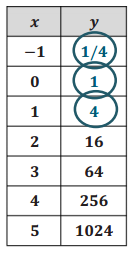
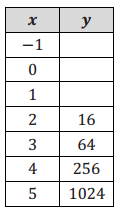
a. Determine the function type that could be used to model the data set, and explain why.
Answer:
Exponential—y – value is being multiplied by constant value 4.
b. Complete the data set using the special pattern of the function you described in part (a).
Answer:
See responses in the completed table.
c. If it exists, find the minimum or maximum value for the function model. If there is no minimum or maximum, explain why.
Answer:
Since this is an exponential function, the y – values increase as x – values increase, and there is no maximum value. As x gets smaller and smaller (i.e., moves further to the left on the number line), the y – values approach 0 but never reach 0 and never become negative. Therefore, there is no minimum value of this function.
Question 3.
Answer:
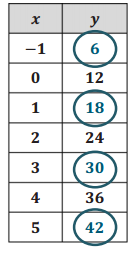
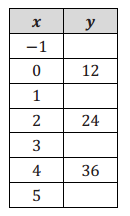
a. Determine the function type that could be used to model the data set, and explain why.
Answer:
Linear—the first difference is 6.
b. Complete the data set using the special pattern of the function you described in part (a).
Answer:
See responses in the completed table.
c. If it exists, find the minimum or maximum value for the function model. If there is no minimum or maximum, explain why.
Answer:
There is no minimum or maximum value for a linear function (except for a horizontal line). For this function, the y – values decrease as the x – values decrease, and the y – values increase as the x – values increase.
Question 4.
Circle all the function types that could possibly be used to model a context if the given statement applies.
a. When x – values are at regular intervals, the first difference of y – values is not constant.
Linear Function Quadratic Function Exponential Function Absolute Value Function
Answer:

b. When x – values are at regular intervals, the second difference of y – values is not constant.
Linear Function Quadratic Function Exponential Function Absolute Value Function
Answer:

c. When x – values are at regular intervals, the quotient of any two consecutive y – values is a constant that is not equal to 0 or 1.
Linear Function Quadratic Function Exponential Function Absolute Value Function
Answer:

d. There may be up to two different x – values for y = 0.
Linear Function Quadratic Function Exponential Function Absolute Value Function
Answer:

Eureka Math Algebra 1 Module 5 Lesson 2 Exit Ticket Answer Key
Question 1.
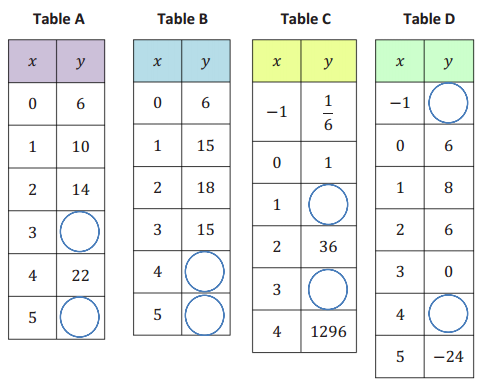
Analyze these data sets, recognizing the unique pattern and key feature(s) for each relationship. Then use your findings to fill in the missing data, match to the correct function from the list on the right, and describe the key feature(s) that helped you choose the function.
Equations:
f(x) = 6x
h(x) = – 3(x – 2)2 + 18
g(x) = – 2(x + 1)(x – 3)
r(x) = 4x + 6
Table A: __________________ Key Feature(s): ________________________________________________________
Table B: __________________ Key Feature(s): ________________________________________________________
Table C: __________________ Key Feature(s): ________________________________________________________
Table D: __________________ Key Feature(s): ________________________________________________________
Answer:
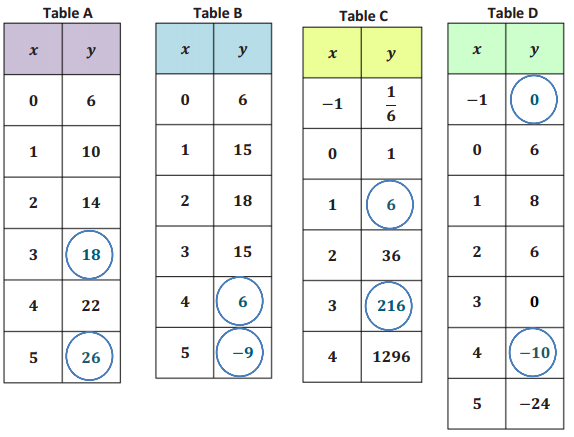
Table A: r(x) = 4x + 6 Key Feature(s): Constant slope (first difference) is 4
Table B: h(x) = – 3(x – 2)2 + 18 Key Feature(s): (2, 18) is the maximum point; Second difference is –6
Table C: f(x) = 6x Key Feature(s): Exponential growth; Common ratio is 6
Table D: g(x) = – 2(x + 1)(x – 3) Key Feature(s): x – intercepts ( – 1, 0) and (3, 0); Second difference is –4