Engage NY Eureka Math Algebra 1 Module 5 Lesson 1 Answer Key
Eureka Math Algebra 1 Module 5 Lesson 1 Example Answer Key
Example 1.
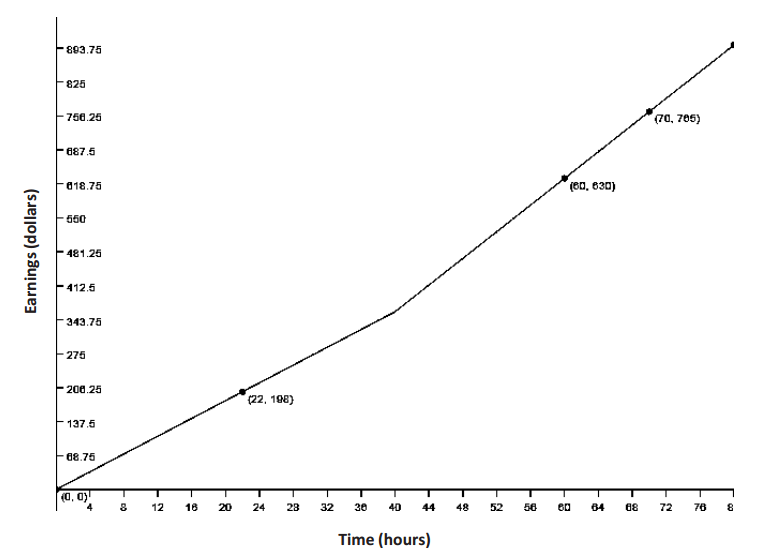
Eduardo has a summer job that pays him a certain rate for the first 40 hours each week and time – and – a – half for any overtime hours. The graph below shows how much money he earns as a function of the hours he works in one week.
Answer:
Start by asking students to consider the function equation for this graph, and ask them to justify their choices. If students are unable to come up with viable options, consider using this scaffolding suggestion. Otherwise skip to the questions that follow, and use them to guide the discussion. Try to use as little scaffolding as possible in this section so that students have an experience closer to a true modeling situation.
→ Right now we are in the formulate stage of the modeling cycle. This means we are starting with a problem and selecting a model (symbolic, analytical, tabular, and/or graphic) that can represent the relationship between the variables used in the context. What are the variables in this problem? What are the units?
→ Time worked (in hours); earnings (in dollars)
→ We have identified the variables. Now let’s think about how the problem defines the relationship between the variables.
→ The number of dollars earned is dependent on the number of hours worked. The relationship is piecewise linear because the average rate of change is constant for each of the intervals (pieces), as depicted in the graph.
→ So what does this graph tell you about Eduardo’s pay for his summer job?
He has a constant pay rate up to 40 hours, and then the rate changes to a higher amount. (Students may notice that his pay rate from 0 to 40 hours is $9, and from 40 hours on is $13.50.)
→ The graph shows us the relationship. In fact, it is an important part of the formulating step because it helps us to better understand the relationship. Why would it be important to find the analytical representation of the function as well?
The equation captures the essence of the relationship succinctly and allows us to find or estimate values that are not shown on the graph.
→ How did you choose the function type? What were the clues in the graph?
Visually, the graph looks like two straight line segments stitched together. So, we can use a linear function to model each straight line segment. The presence of a sharp corner usually indicates a need for a piecewise defined function.
→ There are four points given on the graph. Is that enough to determine the function?
In this case, yes. Each linear piece of the function has two points, so we could determine the equation for each.
What do you notice about the pieces of the graph?
The second piece is steeper than the first; they meet where x = 40; the first goes through the origin; there are two known points for each piece
Eureka Math Algebra 1 Module 5 Lesson 1 Exercise Answer Key
Opening Exercise
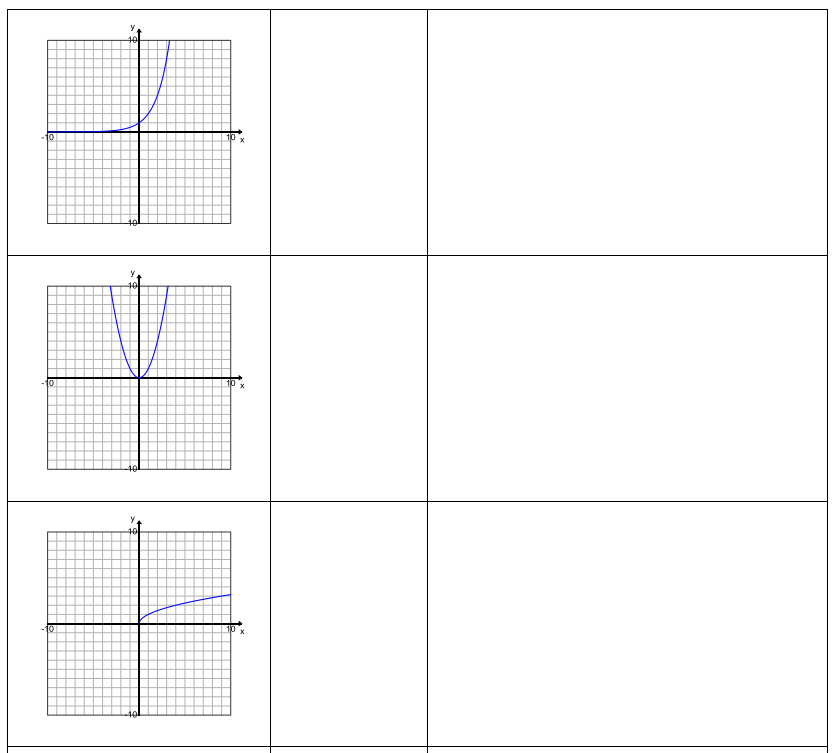
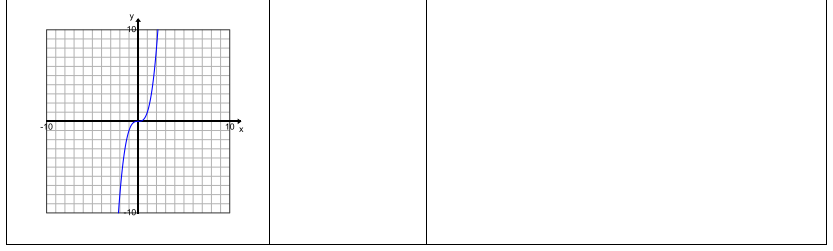
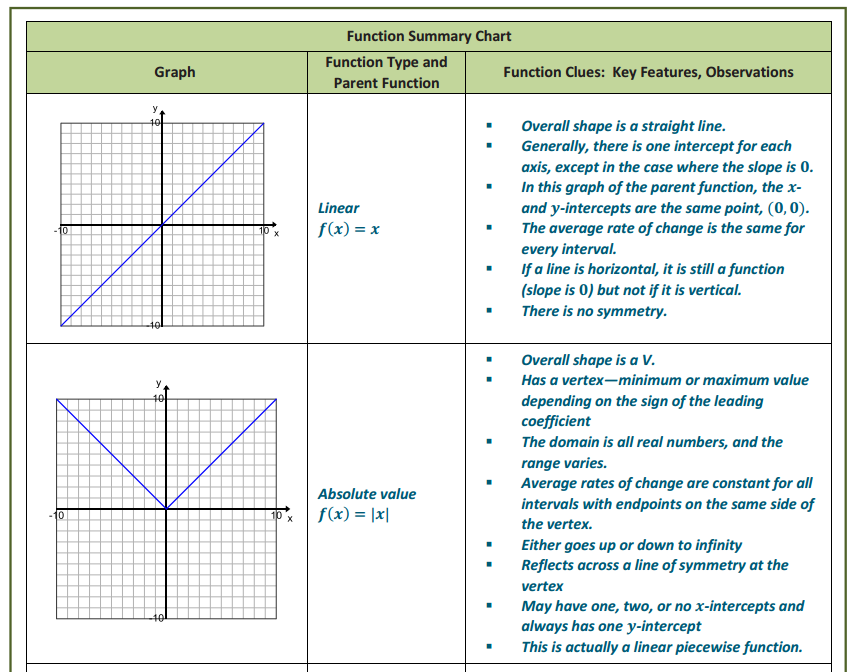
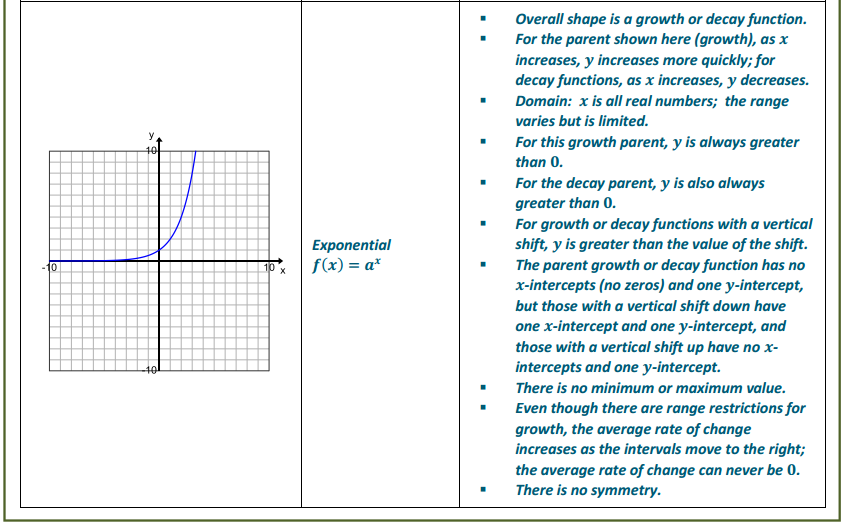
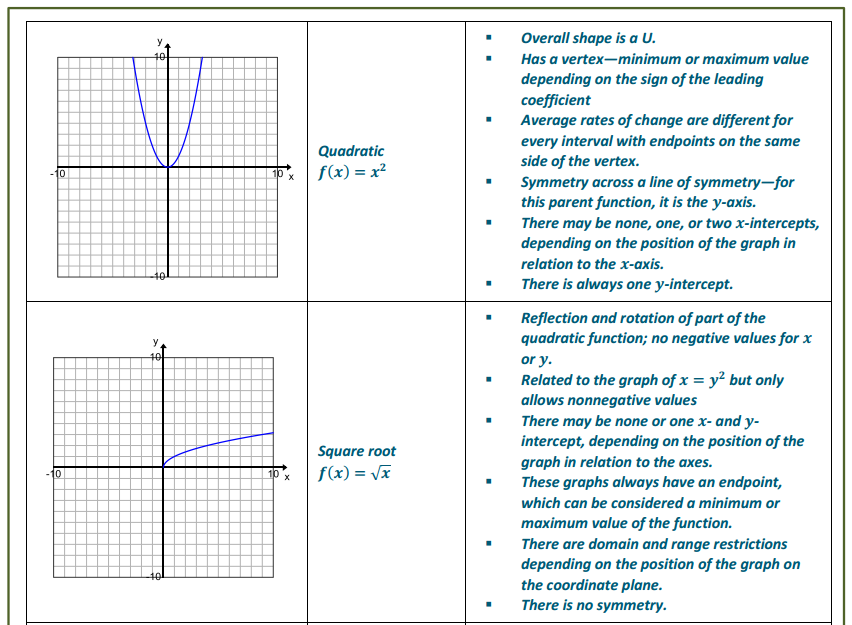
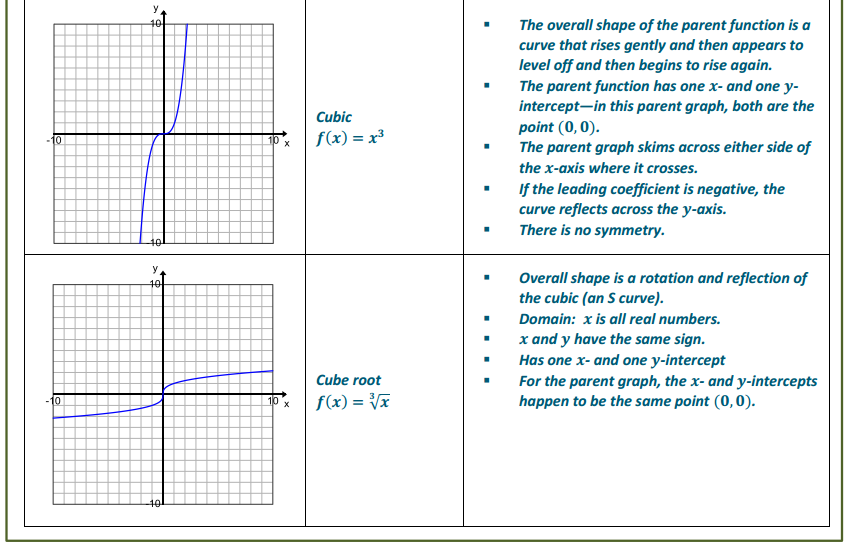
The graphs below give examples for each parent function we have studied this year. For each graph, identify the function type and the general form of the parent function’s equation; then offer general observations on the key features of the graph that helped you identify the function type. (Function types include linear, quadratic, exponential, square root, cube root, cubic, absolute value, and other piecewise functions. Key features may include the overall shape of the graph,
x – and y – intercepts, symmetry, a vertex, end behavior, domain and range values or restrictions, and average rates of change over an interval.)
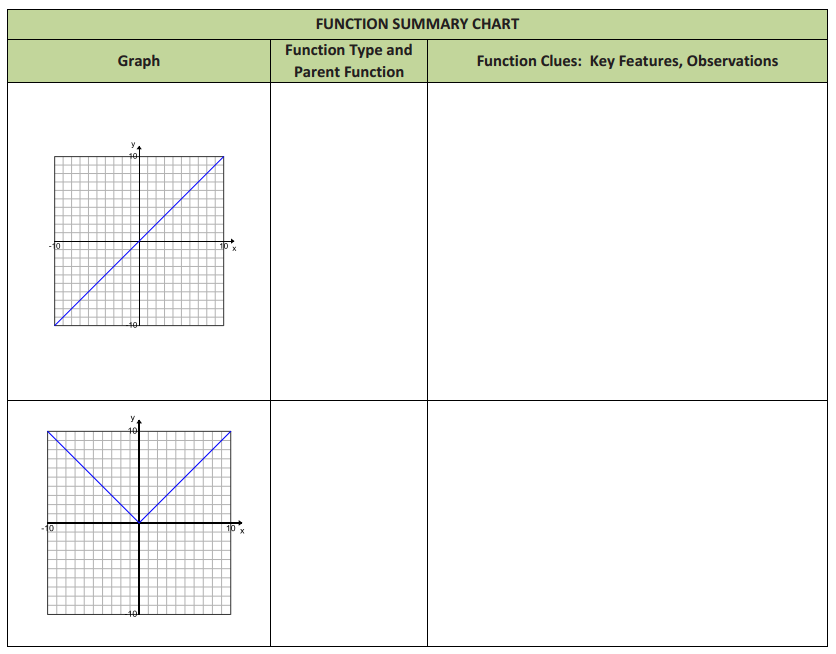
Answer:
Exercises
Exercise 1.
Write the function in analytical (symbolic) form for the graph in Example 1.
a. What is the equation for the first piece of the graph?
Answer:
The two points we know are (0, 0) and (22, 198). The slope of the line is 9 (or $9/hour), and the equation is f(x) = 9x.
b. What is the equation for the second piece of the graph?
Answer:
The second piece has the points (60, 630) and (70, 765). The slope of the line is 13.5 (or $13.50/hour), and the equation in point – slope form would be either y – 630 = 13.5(x – 60) or y – 765 = 13.5(x – 70), with both leading to the function, f(x) = 13.5x – 180.
c. What are the domain restrictions for the context?
Answer:
The graph is restricted to one week of work with the first piece starting at x = 0 and stopping at x = 40. The second piece applies to x – values greater than 40. Since there are 168 hours in one week, the absolute upper limit should be 168 hours. However, no one can work nonstop, so setting 80 hours as an upper limit would be reasonable. Beyond 168 hours, Eduardo would be starting the next week and would start over with $9/hour for the next 40 hours.
d. Explain the domain in the context of the problem.
Answer:
The first piece starts at x = 0 and stops at x = 40. The second piece starts at x>40. From 0 to 40 hours the rate is the same: $9/hour. Then, the rate changes to $13.50/hour at x>40. After 80 hours, it is undefined since Eduardo would need to sleep.
For each graph below, use the questions and identified ordered pairs to help you formulate an equation to represent it.
Exercise 2.
Function type:
Parent function:
Transformations:
Equation:
Answer:
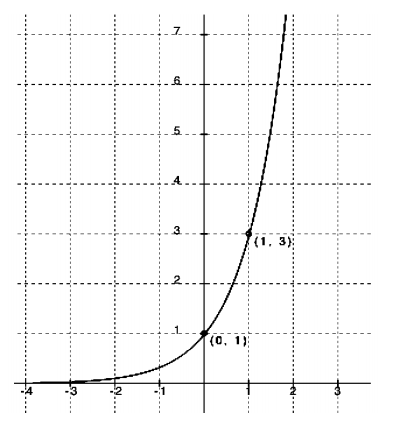
Function type: Exponential
Parent function: f(x) = ax
Transformations: It appears that the graph could be that of a parent function because it passes through (0, 1), and the x – axis is a horizontal asymptote.
Equation: The fact that the graph passes through the point (0, 1) and the x – axis is a horizontal asymptote indicates there is no stretch factor or translation.
Finding a using (1, 3):
3 = a1
3 = a
f(x) = 3x
Exercise 3.
Function type:
Parent function:
Transformations:
Equation:
Answer:
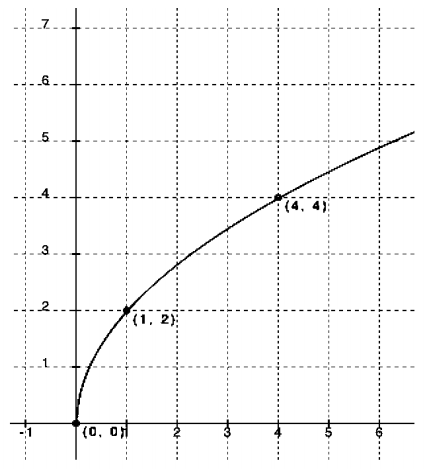
Function type: Square root
Parent function: f(x) = \(\sqrt{x}\)
Transformations: Appears to be a stretch
Equation: f(x) = a\(\sqrt{x}\)
Checking for stretch or shrink factor using (4, 4):
4 = a\(\sqrt{4}\)
4 = a(2)
2 = a
Checking a = 2 with (1, 2):
2 = 2\(\sqrt{1}\)
2 = 2 Yes
f(x) = 2\(\sqrt{x}\)
Note: Students may need a hint for this parent function since they have not worked much with square root functions. Additionally, the stretch factor could be inside or outside the radical. You might ask students who finish early to try it both ways and verify that the results are the same (you could use f(x) = a\(\sqrt{x}\) or f(x) = \(\sqrt{bx}\)).
Exercise 4.
Function type:
Parent function:
Transformations:
Equation:
Answer:
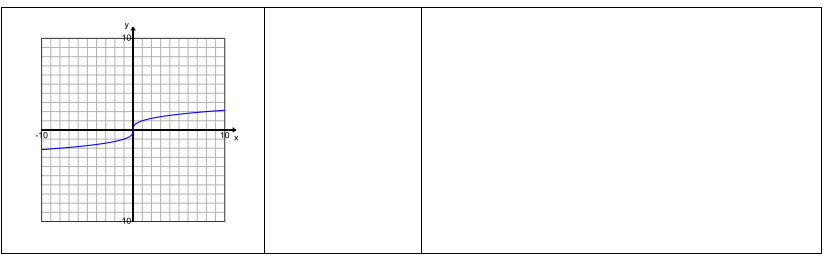
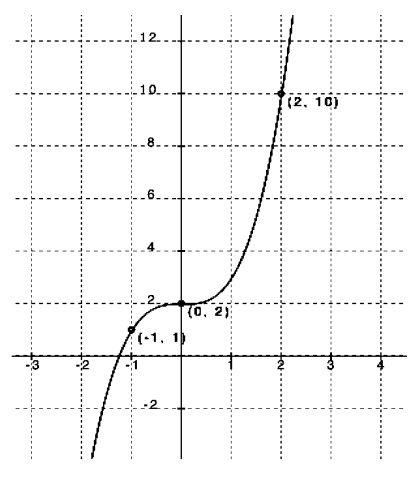
Function type: Cubic
Parent function: f(x) = x3
Transformations: Appears to be a vertical shift of 2 with no horizontal shift
Equation: f(x) = ax3 + 2
Checking for stretch or shrink with ( – 1, 1):
1 = a( – 1)3 + 2
1 = a (no stretch or shrink)
Checking with (2, 10):
10 = (2)3 + 2
10 = 8 + 2
10 = 10 Yes
f(x) = x3 + 2
Exercise 5.
Function type:
Parent function:
Transformations:
Equation:
Answer:
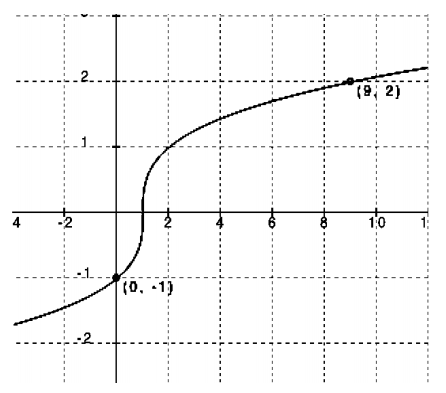
Parent function: f(x) = \(\sqrt [ 3 ]{ x }\)
Transformations: Appears to be a shift to the right of 1
Equation: f(x) = a\(\sqrt [ 3 ]{ x – 1 }\)
Checking for possible stretch or shrink using (9, 2):
2 = a\(\sqrt [ 3 ]{ 9 – 1 }\)
1 = a (no stretch or shrink)
Now check (0, – 1):
– 1 = \(\sqrt [ 3 ]{ 0 – 1 }\)
– 1 = – 1 Yes
f(x) = \(\sqrt [ 3 ]{ x – 1 }\)
Exercise 6.
Function type:
Parent function:
Transformations:
Equation:
Answer:
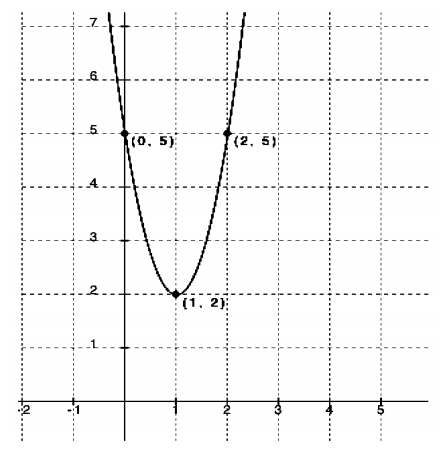
Function type: Quadratic
Parent function: f(x) = x2
Transformations: Shift up 2 units and to the right 1 unit
Equation: Using the vertex form with (1, 2):
f(x) = a(x – 1)2 + 2
Finding the stretch or shrink factor using (0, 5):
5 = a(0 – 1)2 + 2
3 = a(1)
a = 3
Checking with (2, 5):
5 = 3(2 – 1)2 + 2
3 = 3(2 – 1)
3 = 3(1) Yes. There is a stretch factor of 3.
f(x) = 3(x – 1)2 + 2
Eureka Math Algebra 1 Module 5 Lesson 1 Problem Set Answer Key
Question 1.
During tryouts for the track team, Bob is running 90 – foot wind sprints by running from a starting line to the far wall of the gym and back. At time t = 0, he is at the starting line and ready to accelerate toward the opposite wall. As t approaches 6 seconds, he must slow down, stop for just an instant to touch the wall, turn around, and sprint back to the starting line. His distance, in feet, from the starting line with respect to the number of seconds that has passed for one repetition is modeled by the graph below.
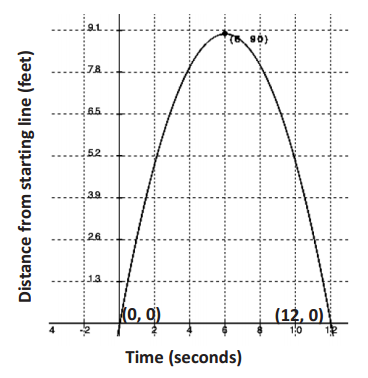
a. What are the key features of this graph?
Answer:
The graph appears to represent a quadratic function. The maximum point is at (6, 90). The zeros are at (0, 0) and (12, 0).
b. What are the units involved?
Answer:
Distance is measured in feet and time in seconds.
c. What is the parent function of this graph?
Answer:
We will attempt to model the graph with a quadratic function. The parent function could be f(t) = t2.
d. Were any transformations made to the parent function to get this graph?
Answer:
It has a negative leading coefficient, and it appears to shift up 90 units and to the right 6 units.
e. What general analytical representation would you expect to model this context?
Answer:
f(t) = a(t – h)2 + k
f. What do you already know about the parameters of the equation?
Answer:
a < 0, h = 6, k = 90
g. Use the ordered pairs you know to replace the parameters in the general form of your equation with constants so that the equation will model this context. Check your answer using the graph.
Answer:
To find a, substitute (0, 0) for (x, y) and (6, 90) for (h, k):
0 = a(0 – 6)2 + 90
– 90 = a(36)
a = – \(\frac{90}{36}\) = – 2.5
f(t) = – 2.5(t – 6)2 + 90
Now check it with (12, 0):
0 = – 2.5(12 – 6)2 + 90
– 90 = – 2.5(36)
– 90 = – 90 Yes
Question 2..
Spencer and McKenna are on a long – distance bicycle ride. Spencer leaves one hour before McKenna. The graph below shows each rider’s distance in miles from his or her house as a function of time since McKenna left on her bicycle to catch up with Spencer. (Note: Parts (e), (f), and (g) are challenge problems.)
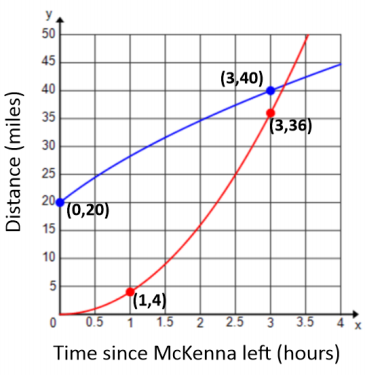
a. Which function represents Spencer’s distance? Which function represents McKenna’s distance? Explain your reasoning.
Answer:
The function that starts at (0, 20) represents Spencer’s distance since he had a 1 – hour head start. The function that starts at (0, 0) represents McKenna’s distance since the graph is described as showing distance since she started riding. That means at the time she started riding (t = 0 hours), her distance would need to be 0 miles.
b. Estimate when McKenna catches up to Spencer. How far have they traveled at that point in time?
Answer:
McKenna will catch up with Spencer after about 3.25 hours. They will have traveled approximately 41 miles at that point.
c. One rider is speeding up as time passes and the other one is slowing down. Which one is which, and how can you tell from the graphs?
Answer:
I know that Spencer is slowing down because his graph is getting less steep as time passes. I know that McKenna is speeding up because her graph is getting steeper as time passes.
d. According to the graphs, what type of function would best model each rider’s distance?
Answer:
Spencer’s graph appears to be modeled by a square root function. McKenna’s graph appears to be quadratic.
e. Create a function to model each rider’s distance as a function of the time since McKenna started riding her bicycle. Use the data points labeled on the graph to create a precise model for each rider’s distance.
Answer:
If Spencer started 1 hour before McKenna, then ( – 1, 0) would be a point on his graph. Using a square root function in the form f(x) = k\(\sqrt{x + 1}\) would be appropriate. To find k, substitute (0, 20) into the function.
20 = k\(\sqrt{0 + 1}\)
20 = k
So, f(x) = 20\(\sqrt{x + 1}\). Check with the other point (3, 40):
f(3) = 20\(\sqrt{3 + 1}\)
f(3) = 20\(\sqrt{4}\) = 40
For McKenna, using a quadratic model would mean the vertex must be at (0, 0). A quadratic function in the form g(x) = kx2 would be appropriate. To find k, substitute (1, 4) into the function.
4 = k(1)2
4 = k
So, g(x) = 4x2. Check with the other point (3, 36): g(3) = 4(3)2 = 36.
f. What is the meaning of the x – and y – intercepts of each rider in the context of this problem?
Answer:
Spencer’s x – intercept ( – 1, 0) shows that he starts riding one hour before McKenna. McKenna’s x – intercept shows that at time 0, her distance from home is 0, which makes sense in this problem. Spencer’s y – intercept (0, 20) means that when McKenna starts riding one hour after he begins, he has already traveled 20 miles.
g. Estimate which rider is traveling faster 30 minutes after McKenna started riding. Show work to support your answer.
Answer:
Spencer:
\(\frac{f(0.5) – f(0.4)}{0.5 – 0.4}\) ≈ 8.3
McKenna:
\(\frac{g(0.5) – g(0.4)}{0.5 – 0.4}\) = 3.6
On the time interval from [0.4, 0.5], Spencer’s average rate of change was approximately 8.3 mph, and McKenna’s average rate of change was 3.6 mph. Therefore, Spencer is traveling faster than McKenna
30 minutes after McKenna begins riding because his average rate of change is greater than McKenna’s average rate of change.
Eureka Math Algebra 1 Module 5 Lesson 1 Exit Ticket Answer Key
Read the problem description, and answer the questions below. Use a separate piece of paper if needed.
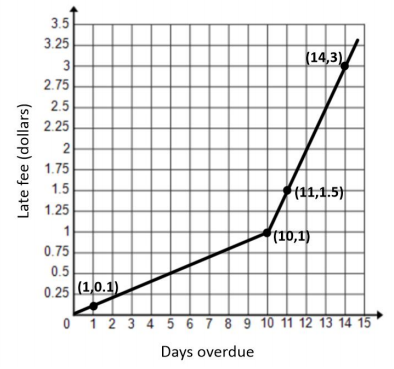
A library posted a graph in its display case to illustrate the relationship between the fee for any given late day for a borrowed book and the total number of days the book is overdue. The graph, shown below, includes a few data points for reference. Rikki has forgotten this policy and wants to know what her fine would be for a given number of late days. The ordered pairs on the graph are (1, 0.1), (10, 1), (11, 1.5), and (14, 3).
Question 1.
What type of function is this?
Answer:
Piecewise linear
Question 2.
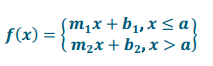
What is the general form of the parent function(s) of this graph?
Answer:
Question 3.
What equations would you expect to use to model this context?
Answer:
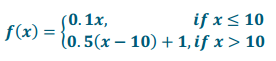
Students may be more informal in their descriptions of the function equation and might choose to make the domain restriction of the second piece inclusive rather than the first piece since both pieces are joined at the same point.
Question 4.
Describe verbally what this graph is telling you about the library fees.
Answer:
The overdue fee is a flat rate of $0.10 per day for the first 10 days and then increases to $0.50 per day after 10 days. The fee for each of the first 10 days is $0.10, so the fee for 10 full days is $0.10(10) = $1.00. Then, the fee for 11 full days of late fees is $1.00 + $0.50 = $1.50, etc. (From then on, the fee increases to $0.50 for each additional day.)
Question 5.
Compare the advantages and disadvantages of the graph versus the equation as a model for this relationship. What would be the advantage of using a verbal description in this context? How might you use a table of values?
Answer:
Graphs are visual and allow us to see the general shape and direction of the function. However, equations allow us to determine more exact values since graphs only allow for estimates for any non – integer values. The late – fee scenario depends on integer number of days only; other scenarios may involve independent variables of non – integer values (e.g., gallons of gasoline purchased). In this case, a table could be used to show the fee for each day but could also show the accumulated fees for the total number of days. For example, for 15 days, the fees would be $1.00 for the first 10 plus $2.50 for the next 5, for a total of $3.50.
Question 6.
What suggestions would you make to the library about how it could better share this information with its customers? Comment on the accuracy and helpfulness of this graph.
Answer:
Rather than displaying the late fee system in a graph, a table showing the total fine for the number of days late would be clearer. If a graph is preferred, it might be better to use a discrete graph, or even a step graph, since the fees are not figured by the hour or minute but only by the full day. While the given graph shows the rate for each day, most customers would rather know, at a glance, what they owe, in total, for their overdue books.