Engage NY Eureka Math Algebra 1 Module 4 Lesson 8 Answer Key
Eureka Math Algebra 1 Module 4 Lesson 8 Exploratory Challenge 1 Answer Key
Exploratory Challenge 1
Below are some examples of curves found in architecture around the world. Some of these might be represented by graphs of quadratic functions. What are the key features these curves have in common with a graph of a quadratic function?

The photographs of architectural features above MIGHT be closely represented by graphs of quadratic functions. Answer the following questions based on the pictures.
a. How would you describe the overall shape of a graph of a quadratic function?
Answer:
Student answers will vary. They may use the letter U or a physical object (cup, bowl) to describe the shape. Pose a question for students to think about during the lesson and discuss at the end of the lesson: “Does the letter U (or a cup or a bowl) give an accurate description of a quadratic function? Why, or why not?” Discuss the symmetric nature of the pictures and draw the line of symmetry on each photograph. (The letter U and the physical objects are not infinite and usually do not continue to widen as they open up or down.)
b. What is similar or different about the overall shape of the above curves?
Answer:
All have either a highest or lowest point and spread out from there. Some are wider or narrower at the base.
IMPORTANT: Many of the photographs in this activity cannot actually be modeled with a quadratic function but rather are catenary curves. These are “quadratic-like” and can be used for our exploration purposes as they display many of the same features, including the symmetry we are exploring in this lesson.
Eureka Math Algebra 1 Module 4 Lesson 8 Exploratory Challenge 2 Answer Key
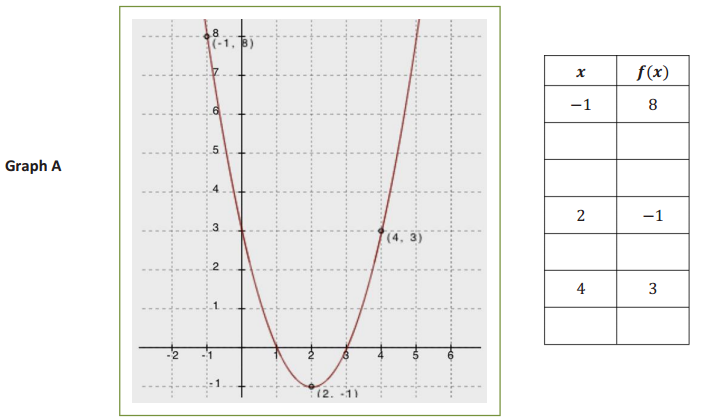
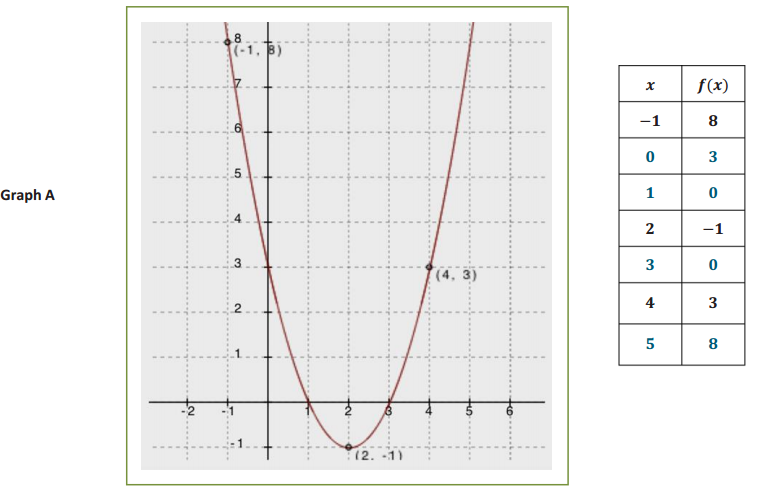
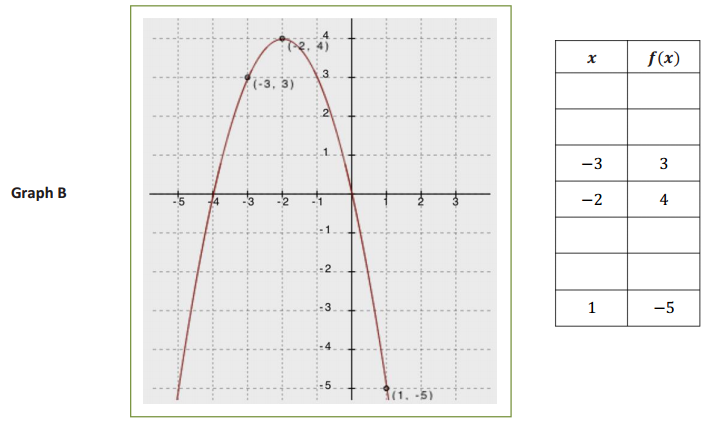
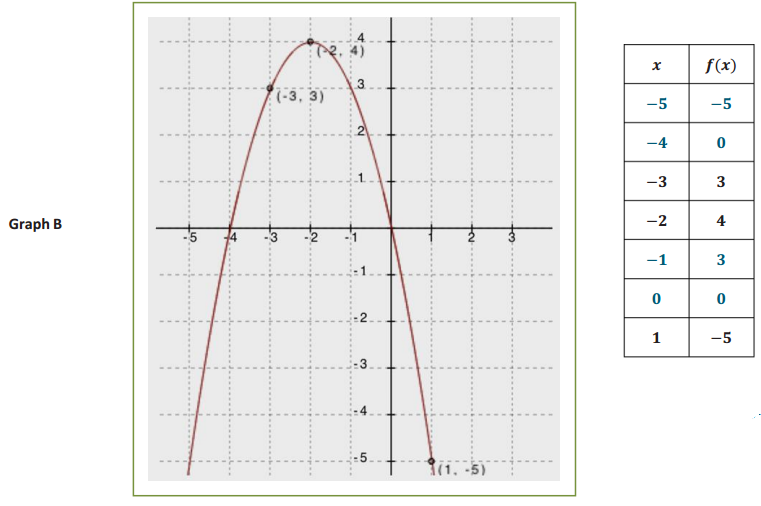
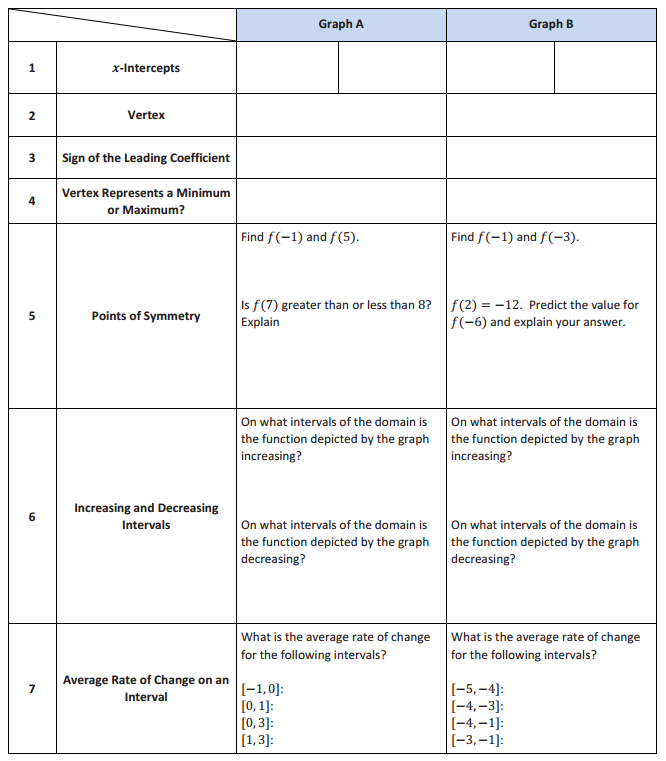
Use the graphs of quadratic functions (Graph A and Graph B) to fill in the table and answer the questions on the following page.
Answer:
Answer:
Solution Note: Students may choose different x-values but are likely to choose the ones they can see on the provided graphs.
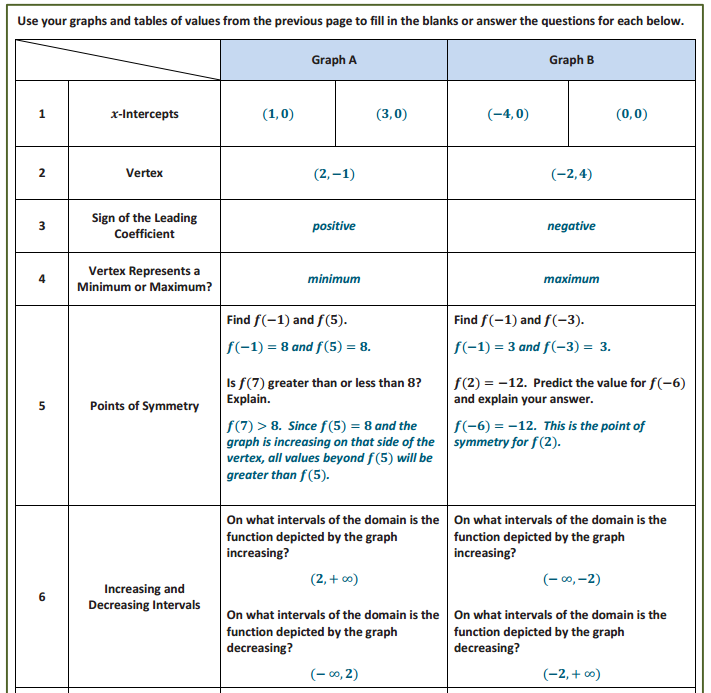
Use your graphs and tables of values from the previous page to fill in the blanks or answer the questions for each below.
Answer:
Understanding the symmetry of quadratic functions and their graphs (Look at the tables and row 5 in the chart.)
a. What patterns do you see in the tables of values you made next to Graph A and Graph B?
Answer:
In both tables, the x-values increase by one, and the y-values either increase and then decrease or vice versa. The y-values move toward the vertex value (either increasing or decreasing) and then begin to retrace earlier y-values symmetrically after passing the vertex and moving away from its y-value again.
Finding the vertex and axis of symmetry (Look at rows 1 and 2 of the chart.)
b. How can we know the x-coordinate of the vertex by looking at the x-coordinates of the zeros (or any pair of symmetric points)?
Answer:
The x-value of the vertex is halfway between any two symmetric points (the average of the x-coordinates). (Developing this concept is crucial for graphing quadratic functions. Build fluency in finding the equation of the axis of symmetry by having students give the equation of the axis of symmetry for several graphs as they work through this lesson.)
Understanding end behavior (Look at rows 3 and 4 of the chart.)
c. What happens to the y-values of the functions as the x-values increase to very large numbers? What about as the x-values decrease to very small numbers (in the negative direction)?
Answer:
At both ends, the y-values increase toward +∞ for Graph A (opens up) and toward -∞ for Graph B (opens down).
d. How can we know whether a graph of a quadratic function opens up or down?
Answer:
When looking at the function’s graph, you can physically see it. When looking at the function’s equation, for those that open down, the leading coefficient is any negative number. (Note: These two functions have 1 and -1 for leading coefficients. If students do not see this connection right away, project the graphs of—or have them graph—several equations in their graphing calculator to see the connection.)
Identifying intervals on which the function is increasing or decreasing (Look at row 6 in the chart.)
e. Is it possible to determine the exact intervals that a quadratic function is increasing or decreasing just by looking at a graph of the function?
Answer:
We can only be certain if enough points of the graph are labeled for us to determine the vertex with certainty.
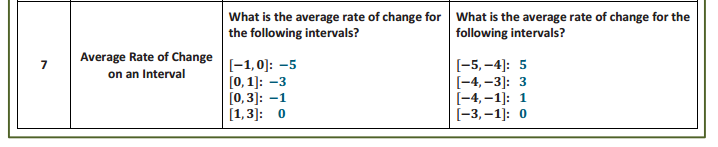
Computing average rate of change on an interval (Look at row 7 in the chart.)
f. Explain why the average rate of change over the interval [1, 3] for Graph A was zero.
Answer:
The function values at the two endpoints of the interval were the same.
g. How are finding the slope of a line and finding the average rate of change on an interval of a quadratic function similar? How are they different?
Answer:
They can both be found using the formula \(\frac{f(a)-f(b)}{a-b}\). However, the average rate of change is the SAME for every interval of a linear function and is typically DIFFERENT for most intervals of a quadratic function.
Finding a unique quadratic function:
h. Can you graph a quadratic function if you don’t know the vertex? Can you graph a quadratic function if you only know the x-intercepts?
Answer:
Students are likely to intuit that they need more than just a vertex but may not see that the x-intercepts are not quite enough. If they do not, move to the next question.
i. Remember that we need to know at least two points to define a unique line. Can you identify a unique quadratic function with just two points? Explain.
Answer:
No, there are many different quadratic functions whose graphs pass through any two given points. (If students think they CAN define a unique quadratic function, try giving the class two symmetry points, for example the x-intercepts, and have each student draw a graph of the quadratic function that passes through those zeros. When they compare with each other, they should find that almost every student in the class found a different graph.)
j. What is the minimum number of points needed to identify a unique quadratic function? Explain why.
Answer:
With three distinct points that are not collinear, you can identify the unique quadratic function that passes through all three. (At this stage, students might have trouble writing the equation from just any three points.)
Eureka Math Algebra 1 Module 4 Lesson 8 Exploratory Challenge 3 Answer Key
Exploratory Challenge 3
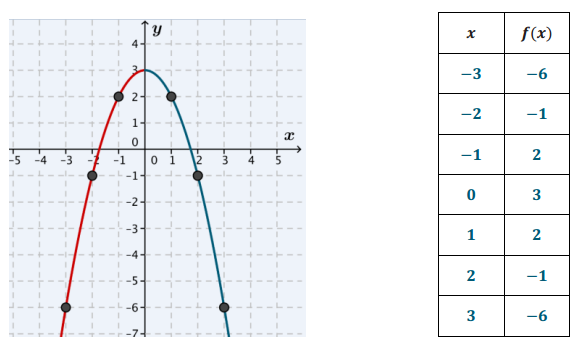
Below you see only one side of the graph of a quadratic function. Complete the graph by plotting three additional points of the quadratic function. Explain how you found these points, and then fill in the table on the right.
Answer:
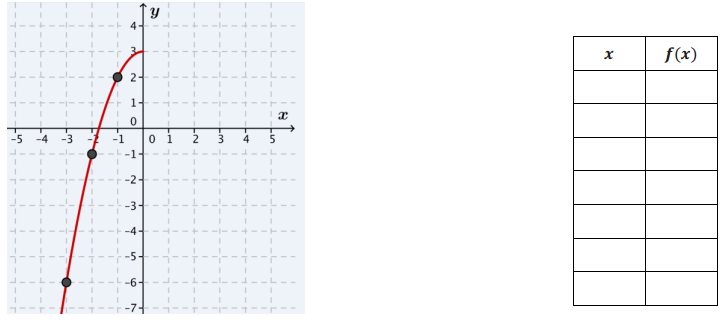
I found the three additional points by using the symmetry of the graph.
a. What are the coordinates of the x-intercepts?
Answer:
(-1.7, 0) and (1.7, 0) (These are estimations but should be close to ±\(\sqrt{3}\).)
b. What are the coordinates of the y-intercept?
Answer:
(0, 3) (Point out that this is also the vertex in this case.)
c. What are the coordinates of the vertex? Is it a minimum or a maximum?
Answer:
The coordinate (0, 3) is a maximum.
d. If we knew the equation for this curve, what would the sign of the leading coefficient be?
Answer:
The leading coefficient would be negative since the graph opens down.
e. Verify that the average rate of change for the interval -3 ≤ x ≤ -2, or [-3, -2], is 5. Show your steps.
Answer:
Using the formula for average rate of change: \(\frac{[f(-2)-f(-3)]}{(-2-(-3))}=\frac{(-1-(-6))}{1}\)=\(\frac{5}{1}\).
f. Based on your answer for row 6 in the table for Exploratory Challenge 2, what interval would have an average rate of change of -5? Explain.
Answer:
2 ≤ x ≤ 3 The quadratic equation is symmetric.
If the graph of the function increases at an average rate of 5, then it should decrease at an average rate of -5.
Eureka Math Algebra 1 Module 4 Lesson 8 Problem Set Answer Key
Question 1.
Khaya stated that every y-value of the graph of a quadratic function has two different x-values. Do you agree or disagree with Khaya? Explain your answer.
Answer:
The graph of a quadratic function has two different x-values for each y-value except at the vertex where there is only one.
Question 2.
Is it possible for the graphs of two different quadratic functions to each have x=-3 as its line of symmetry and both have a maximum at y=5? Explain and support your answer with a sketch of the graphs.
Answer:
Students should sketch two graphs with vertex at (-3, 5) and different x-intercepts.
Question 3.
Consider the following key features discussed in this lesson for the four graphs of quadratic functions below: x-intercepts, y-intercept, line of symmetry, vertex, and end behavior.
a. Which key features of a quadratic function do graphs A and B have in common? Which features are not shared?
Answer:
Same—line of symmetry.
Different—vertex, y-intercept, x-intercepts, and end behavior.
b. Compare graphs A and C, and explain the differences and similarities between their key features.
Answer:
Same—line of symmetry, vertex, x-intercepts, y-intercept, and end behavior.
Different—none, Graphs A and C are the same. The images of the graphs are cropped differently, so it may appear that the two are different.
c. Compare graphs A and D, and explain the differences and similarities between their key features.
Answer:
Same—line of symmetry and vertex
Different—x-intercepts (point out that Graph D does not have x-intercepts), y-intercept, and end behavior.
d. What do all four of the graphs have in common?
Answer:
All four graphs have the same line of symmetry.
Question 4.
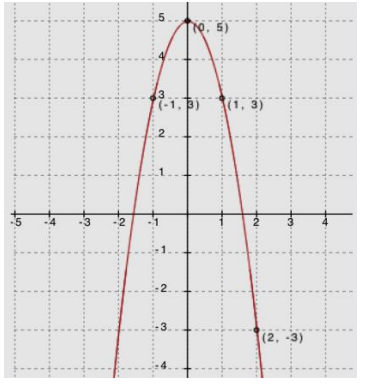
Use the symmetric properties of quadratic functions to sketch the graph of the function below, given these points and given that the vertex of the graph is the point (0, 5).
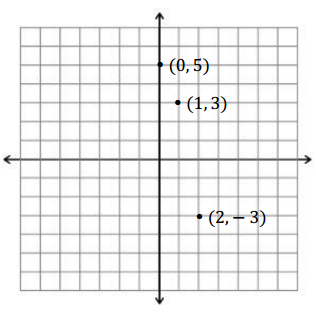
Answer:
Eureka Math Algebra 1 Module 4 Lesson 8 Exit Ticket Answer Key
Question 1.
If possible, find the equation for the axis of symmetry for the graph of a quadratic function with the given pair of coordinates. If not possible, explain why.
a. (3, 10) (15, 10)
Answer:
Even though the coordinate values are not x-intercepts, students can use the symmetric nature of the function to find that the equation of the axis of symmetry goes through the midpoint joining the two x-coordinates of the symmetric points, or the average of the values of the two coordinates:
x=\(\frac{3+15}{2}\)=\(\frac{18}{2}\)=9. So, x=9 is the equation for the axis of symmetry.
b. (-2, 6) (6, 4)
Answer:
The given coordinates are not symmetric values; therefore, we cannot find the equation of the axis of symmetry.
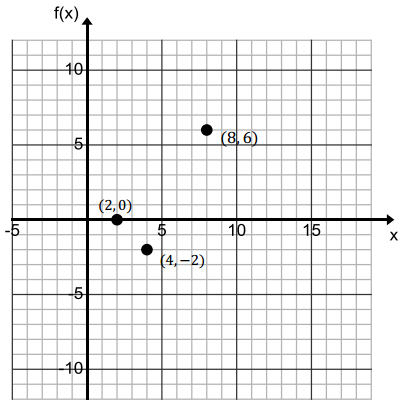
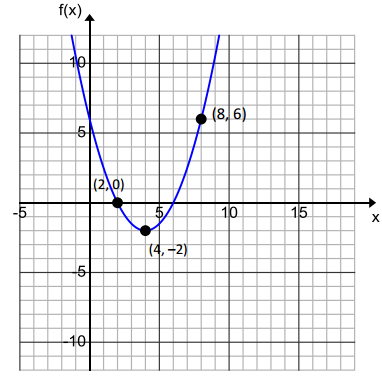
Question 2.
The point (4, -2) is the vertex of the graph of a quadratic function. The points (8, 6) and (2, 0) also fall on the graph of the function. Complete the graph of this quadratic function by first finding two additional points on the graph. (If needed, make a table of values on your own paper.) Then, answer the questions on the right.
Answer:
a. Find the y-intercept.
Answer:
(0, 6)
b. Find the x-intercept(s).
Answer:
(2, 0) (6, 0)
c. Find the interval on which the rate of change is always positive.
Answer:
(4, ∞) or x > 4
d. What is the sign of the leading coefficient for this quadratic function? Explain how you know.
Answer:
Positive. Since the vertex is the minimum value of the graph (opens upward), the leading coefficient is positive.