Engage NY Eureka Math Algebra 1 Module 4 Lesson 17 Answer Key
Eureka Math Algebra 1 Module 4 Lesson 17 Example Answer Key
Example
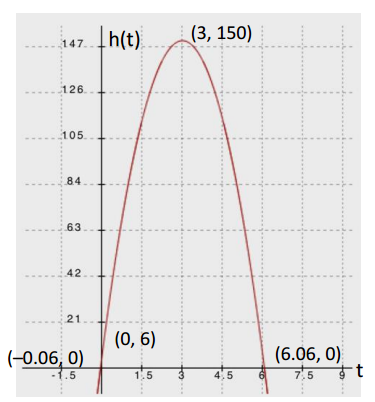
A high school baseball player throws a ball straight up into the air for his math class. The math class was able to determine that the relationship between the height of the ball and the time since it was thrown could be modeled by the function h(t) = – 16t2 + 96t + 6, where t represents the time (in seconds) since the ball was thrown, and h represents the height (in feet) of the ball above the ground.
a. What do you notice about the equation, just as it is, that will help us in creating our graph?
Answer:
The leading coefficient is negative, so we know the graph opens down. h(0) = 6, so the point (0,6), which is the y – intercept, is on the graph.
b. Can we factor to find the zeros of the function? If not, solve h(t) = 0 by completing the square.
Answer:
This function is not factorable, so we complete the square to find the zeros to be (6.06,0) and ( – 0.06,0).
c. What is the vertex of the function? What method did you use to find the vertex?
Answer:
Since we already completed the square (and the zeros are irrational and more difficult to work with), we can easily find the vertex using the completed – square form, h(t) = – 16(t – 3)2 + 150, which means the vertex is (3,150).
d. Now plot the graph of h(t) = – 16t2 + 96t + 6, and label the key features on the graph.

Answer:
Eureka Math Algebra 1 Module 4 Lesson 17 Exercise Answer Key
Opening Exercise
A high school baseball player throws a ball straight up into the air for his math class. The math class was able to determine that the relationship between the height of the ball and the time since it was thrown could be modeled by the function h(t) = – 16t2 + 96t + 6, where t represents the time (in seconds) since the ball was thrown, and h represents the height (in feet) of the ball above the ground.
a. What does the domain of the function represent in this context?
Answer:
The time (number of seconds) since the ball was thrown
b. What does the range of this function represent?
Answer:
The height (in feet) of the ball above the ground
c. At what height does the ball get thrown?
Answer:
The initial height of the ball is when t is 0 sec. (i.e., h(0)), which is the y – intercept. The initial height is 6 ft.
d. After how many seconds does the ball hit the ground?
Answer:
The ball’s height is 0 when h(t) = 0. We can solve using any method. Since this does not appear to be easily factorable, and the size of the numbers might be cumbersome in the quadratic formula, let’s solve by completing the square.
– 16t2 + 96t + 6 = 0
– 16(t2–6t) = – 6
– 16(t2 – 6t + 9) = – 6 – 144
From here, we see the completed – square form: h(t) = – 16(t – 3)2 + 150.
– 16(t – 3)2 = – 150
(t – 3)2 = \(\frac{150}{16}\)
t – 3 = ±\(\frac{\sqrt{150}}{4}\)
t = 3 ±\(\frac{\sqrt{150}}{4}\)
t ≈ 6.0618 or – 0.0618
For this context, the ball hits the ground at approximately 6.1 seconds.
e. What is the maximum height that the ball reaches while in the air? How long will the ball take to reach its maximum height?
Answer:
Completing the square (and using the work from the previous question), we get h(t) = – 16(t – 3)2 + 150, so the vertex is (3,150), meaning that the maximum height is 150 ft., and it will reach that height in 3 sec.
f. What feature(s) of this quadratic function are visible since it is presented in the standard form, f(x) = ax2 + bx + c?
Answer:
We can see the initial position, or height of the ball, or the height when t = 0, in the constant term. We can also see the leading coefficient, which tells us about the end behavior and whether the graph is wider or narrower than the graph of f(x) = x2.
g. What feature(s) of this quadratic function are visible when it is rewritten in vertex form, f(x) = a(x – h)2 + k?
Answer:
We can only see the coordinates of the vertex and know that x = h is the equation of the axis of symmetry. We can still see the leading coefficient in this form, which tells us about the end behavior and whether the graph is wider or narrower than the graph of f(x) = x2.
A general strategy for graphing a quadratic function from the standard form:
Answer:
→ Look for hints in the function’s equation for general shape, direction, and y – intercept.
→ Solve f(x) = 0 to find the x – intercepts by factoring, completing the square, or using the quadratic formula.
→ Find the vertex by completing the square or using symmetry. Find the axis of symmetry and the x – coordinate of the vertex using \(\frac{ – b}{2a}\) and the y – coordinate of the vertex by finding f(\(\frac{ – b}{2a}\)).
→ Plot the points you know (at least three are required for a unique quadratic function), sketch the graph of the curve that connects them, and identify the key features of the graph.
Exercises
Exercise 1.
Graph the function n(x) = x2 – 6x + 5, and identify the key features.

Answer:
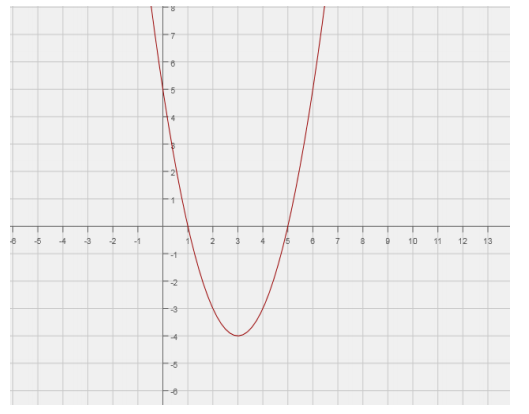
x – intercepts: (5, 0),(1, 0)
y – intercept: (0, 5)
Vertex: (3, – 4)
Exercise 2.
Graph the function f(x) = \(\frac{1}{2}\) x2 + 5x + 6, and identify the key features.

Answer:
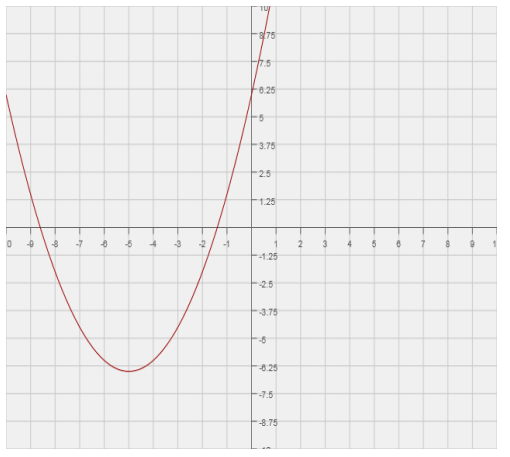
x – intercepts: ( – 5 + \(\sqrt{13}\),0),( – 5 – \(\sqrt{13}\),0)
y – intercept: (0, 6)
Vertex: ( – 5, – 6.5)
Exercise 3.
Paige wants to start a summer lawn – mowing business. She comes up with the following profit function that relates the total profit to the rate she charges for a lawn – mowing job:
P(x) = – x2 + 40x – 100.
Both profit and her rate are measured in dollars. Graph the function in order to answer the following questions.
a. Graph P.

Answer:
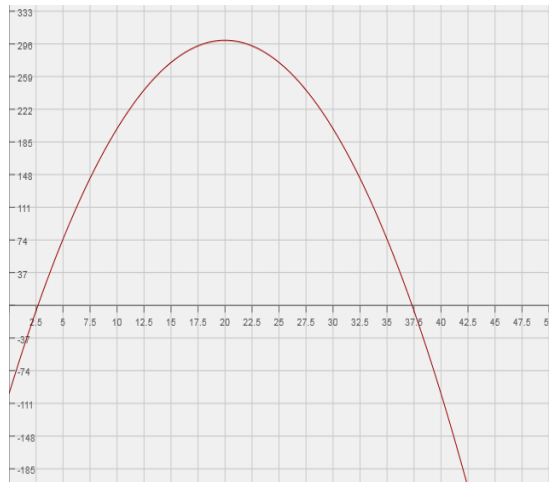
x – intercepts: (20 + 10\(\sqrt{3}\),0),(20 – 10\(\sqrt{3}\))
y – intercept: (0, – 100)
Vertex: (20, 300)
b. According to the function, what is her initial cost (e.g., maintaining the mower, buying gas, advertising)? Explain your answer in the context of this problem.
Answer:
When Paige has not mown any lawns or charged anything to cut grass, her profit would be – 100. A negative profit means that Paige is spending $100 to run her business.
c. Between what two prices does she have to charge to make a profit?
Answer:
Using completing the square, we find the intercepts at (20 + 10\(\sqrt{3}\)) and (20 – 10\(\sqrt{3}\)). However, since this question is about money, we approximate and find that her rates should be between $2.68 and $37.32.
d. If she wants to make a $275 profit this summer, is this the right business choice?
Answer:
Yes. Looking at the graph, the vertex, (20, 300), is the maximum profit. So, if Paige charges $20 for each lawn she mows, she can make a $300 profit, which is $25 more than she wants.
Exercise 4.
A student throws a bag of chips to her friend. Unfortunately, her friend does not catch the chips, and the bag hits the ground. The distance from the ground (height) for the bag of chips is modeled by the function
h(t) = – 16t2 + 32t + 4, where h is the height (distance from the ground in feet) of the chips, and t is the number of seconds the chips are in the air.
a. Graph h.

Answer:
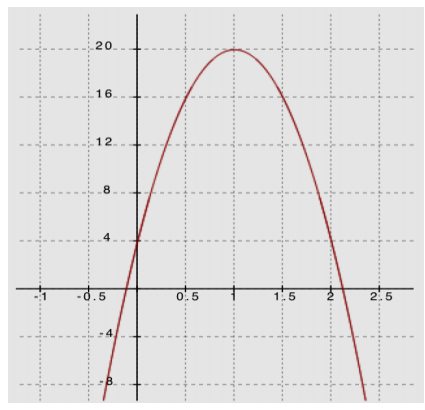
– intercepts: (1 + \(\frac{\sqrt{5}}{2}\),0),(1 – \(\frac{\sqrt{5}}{2}\),0)
h – intercept: (0, 4)
Vertex: (1, 20)
b. From what height are the chips being thrown? Tell how you know.
Answer:
4 ft. This is the initial height, or when t = 0.
c. What is the maximum height the bag of chips reaches while airborne? Tell how you know.
Answer:
From the graph, the vertex is (1,20), which means that at 1 second, the bag is 20 ft. above the ground for this problem. Since this is the vertex of the graph, and the leading coefficient of the quadratic function is negative, the graph opens down (as t → ±∞, h(t) → – ∞), and the vertex is the maximum of the function. This means 20 ft. is the maximum height of the thrown bag.
d. How many seconds after the bag was thrown did it hit the ground?
Answer:
By completing the square, we find that t = 1 ±\(\frac{\sqrt{5}}{2}\). Since this is time in seconds, we need a positive value, 1 + \(\frac{\sqrt{5}}{2}\), which is about 2.12 sec.
e. What is the average rate of change of height for the interval from 0 to 1/2 second? What does that number represent in terms of the context?
Answer:
\(\frac{\left[f\left(\frac{1}{2}\right) – f(0)\right]}{\frac{1}{2} – 0}\) = \(\frac{[16 – 4]}{\frac{1}{2}}\) = 24. The rate of change for the interval from 0 to \(\frac{1}{2}\) sec. is 24 ft/s, which represents the average speed of the bag of chips from 0 to \(\frac{1}{2}\) sec.
f. Based on your answer to part (e), what is the average rate of change for the interval from 1.5 to 2 sec.?
Answer:
The average rate of change for the interval from 1.5 to 2 sec. will be the same as it is from 0 to \(\frac{1}{2}\) except that it will be negative: – 24 ft/s.
Exercise 5.
Notice how the profit and height functions both have negative leading coefficients. Explain why this is.
Answer:
The nature of both of these contexts is that they have continually changing rates, and both require the graph to open down since each would have a maximum. Problems that involve projectile motion have maxima because an object can only go so high before gravity pulls it back down. Profits also tend to increase as prices increase only to a point before sales drop off, and profits begin to fall.
Eureka Math Algebra 1 Module 4 Lesson 17 Problem Set Answer Key
Question 1.
Graph f(x) = x2 – 2x – 15, and identify its key features.

Answer:
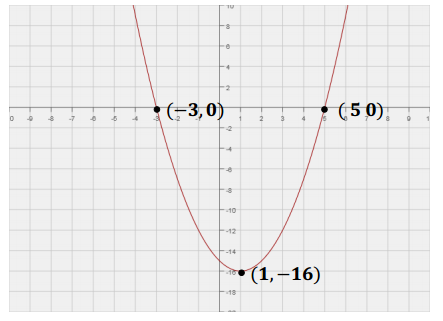
x – intercepts: ( – 3, 0) (5, 0)
y – intercept: (0, – 15)
Vertex: (1, – 16)
End behavior: As x → ±∞, y → ∞.
Question 2.
Graph f(x) = – x2 + 2x + 15, and identify its key features.

Answer:
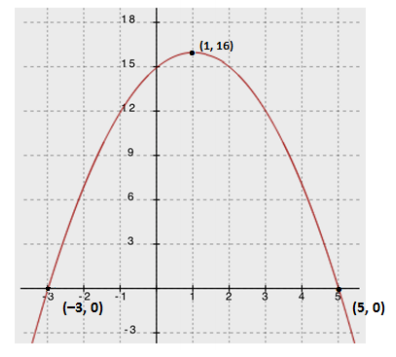
x – intercepts: ( – 3, 0) (5, 0)
y – intercept: (0, 15)
Vertex: (1, 16)
End behavior: As x → ±∞, y → – ∞.
Question 3.
Did you recognize the numbers in the first two problems? The equation in the second problem is the product of – 1 and the first equation. What effect did multiplying the equation by – 1 have on the graph?
Answer:
The graph gets reflected across the x – axis. The x – intercepts remain the same. The y – intercept becomes the opposite of the original y – intercept. The end behavior of the graph reversed. The vertex became the maximum instead of the minimum.
Question 4.
Giselle wants to run a tutoring program over the summer. She comes up with the following profit function:
P(x) = – 2x2 + 100x – 25,
Answer:
where x represents the price of the program. Between what two prices should she charge to make a profit? How much should she charge her students if she wants to make the most profit?
Using the quadratic formula, the two roots are 25 ±\(\frac{35 \sqrt{2}}{2}\), which is about $0.25 and $50. If Giselle charges between $0.25 and $50, she can expect to make a profit. If she charges $25, she will make a maximum profit of $1,225.
Question 5.
Doug wants to start a physical therapy practice. His financial advisor comes up with the following profit function for his business:
P(x) = – \(\frac{1}{2}\) x2 + 150x – 10000
where x represents the amount, in dollars, that he charges his clients. How much will it cost for him to start the business? What should he charge his clients to make the most profit?
Answer:
The formula suggests it would cost him $10,000 to start his business. He should charge $150 to make the most profit.
Eureka Math Algebra 1 Module 4 Lesson 17 Exit Ticket Answer Key
Question 1.
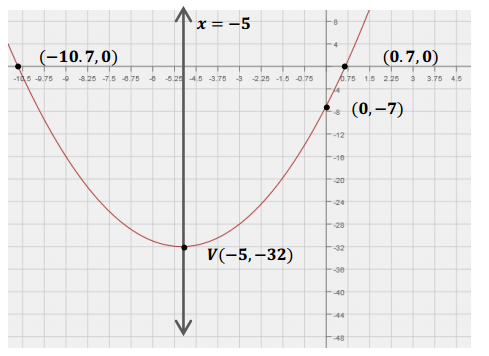
Graph g(x) = x2 + 10x – 7, and identify the key features (e.g., vertex, axis of symmetry, x – and y – intercepts).

Answer: