Engage NY Eureka Math Algebra 1 Module 4 Lesson 10 Answer Key
Eureka Math Algebra 1 Module 4 Lesson 10 Example Answer Key
Example 1.
In a study of the activities of dolphins, a marine biologist made a 24 – second video of a dolphin swimming and jumping in the ocean with a specially equipped camera that recorded one dolphin’s position with respect to time. This graph represents a piecewise function, y = f(t), that is defined by quadratic functions on each interval. It relates the dolphin’s vertical distance from the surface of the water, in feet, to the time from the start of the video, in seconds. Use the graph to answer the questions below.
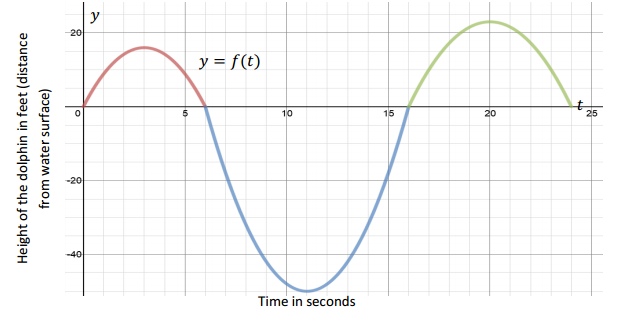
a. Describe what you know for sure about the actions of the dolphin in the time interval from 0–6 sec. Can you determine the horizontal distance the dolphin traveled in that time interval? Explain why or why not.
Answer:
The dolphin jumped out of the water at t = 0 and back into the water at t = 6. We cannot determine the horizontal distance because the function models the vertical distance to time, not the horizontal distance to time.
Some students may interpret the graph as the path (or trajectory) of the dolphin jumping in and out of the water. It is important to point out that the graph does not indicate the forward motion of the dolphin. In fact, the dolphin can jump straight up and straight down, and the relationship of height to time still has the same graph.
b. Where do you find the values for which f(t) = 0? Explain what they mean in the context of this problem.
Answer:
f(0) = 0, f(6) = 0, f(16) = 0, f(24) = 0
f(t) = 0 represents the time when the dolphin enters the water or jumps out of the water. It is when the dolphin is at the water’s surface.
c. How long was the dolphin swimming under water in the recorded time period? Explain your answer or show your work.
Answer:
10 seconds. Between t = 6 and t = 16, f(t) < 0. This means that the dolphin is below the surface of the water.
d. Estimate the maximum height, in feet, that the dolphin jumped in the recorded 24 – second time period? Explain how you determined your answer.
Answer:
The vertex that is in the highest position is estimated to be (20, 23). Students may indicate the vertex during the first jump. However, it is not the maximum of the entire function (24 – second time period).
e. Locate the point on the graph where f(t) = – 50, and explain what information the coordinates of that point give you in the context of this problem.
Answer:
f(11) = – 50. This means after 11 seconds have passed, the dolphin is 50 feet below the water surface.
Example 2.
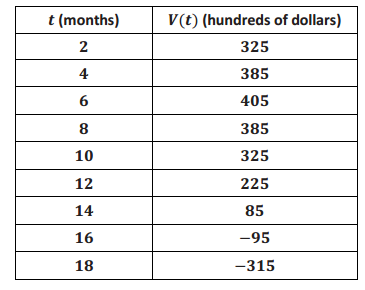
The table below represents the value of Andrew’s stock portfolio, where V represents the value of the portfolio in hundreds of dollars and t is the time in months since he started investing. Answer the questions that follow based on the table of values.
a. What kind of function could model the data in this table? How can you support your conclusion?
Answer:
Students can make the conjecture that it might be quadratic based on the shape suggested by plotting the points or by noticing the suggested symmetry of the data. However, they should not make a claim that all U – shaped curves can be well modeled by a quadratic function. A more robust support would be to notice that the sequence of V(t) values has constant second differences over equally spaced intervals of t, which is the characteristic of sequences defined by a quadratic expression.
b. Assuming this data is in fact quadratic, how much did Andrew invest in his stock initially? Explain how you arrived at this answer.
Answer:
Andrew initially invested $225. I used the symmetric value of the quadratic function to find that V(0) = V(12) = 225.
c. What is the maximum value of his stock, and how long did it take to reach the maximum value?
Answer:
V(6) = 405. It took Andrew 6 months to reach the maximum value of $405.
d. If the pattern continues to follow the quadratic trend shown above, do you advise Andrew to sell or keep his stock portfolio? Explain why.
Answer:
Andrew should sell. The stock initially increased, reaching a maximum value of $405, then decreased. Since this is a quadratic function, it will not increase again. Rather, it continuously decreases after reaching the maximum.
e. How fast is Andrew’s stock value decreasing between [10, 12]? Find another two – month interval where the average rate of change is faster than [10, 12] and explain why.
Answer:
\(\frac{225 – 325}{12 – 10}\) = – \(\frac{100}{2}\) = – 50
The average rate of change of Andrew’s stock portfolio between [10, 12] is – $50. The average rate of change is faster than 50 for any two – month interval after 12 months. Students may calculate the actual rate of change to show that it decreases faster or explain that the quadratic model decreases at a faster rate.
f. Are there other two – month intervals where the rate of change is the same as [10, 12]? Explain your answer.
Answer:
The rate of change for a quadratic function is not constant and changes from positive to zero to negative. It is not possible for another two – month interval to have the same rate of change as [10, 12].
Eureka Math Algebra 1 Module 4 Lesson 10 Problem Set Answer Key
Question 1.
Pettitte and Ryu each threw a baseball into the air.
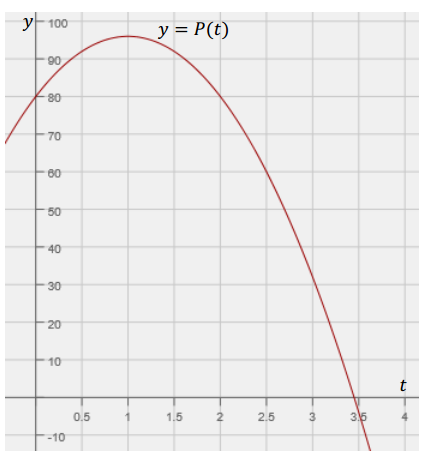
The vertical height of Pettitte’s baseball is represented by the graph y = P(t) below. P represents the vertical distance of the baseball from the ground in feet, and t represents time in seconds.
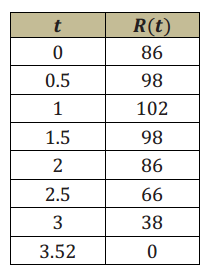
The vertical height of Ryu’s baseball is represented by the table values R(t) below. R represents the vertical distance of the baseball from the ground in feet, and t represents time in seconds.
Use the functions on the previous page to answer the following questions.
a. Whose baseball reached the greatest height? Explain your answer.
Answer:
Ryu’s baseball reached a maximum height of 102 feet, and Pettitte’s baseball reached a maximum height of 96 feet. Students compare the maximum heights represented in the graph and table and interpret the vertex values in context.
b. Whose ball reached the ground fastest? Explain your answer.
Answer:
Pettitte’s ball took less than 3.5 seconds, and Ryu’s ball took more than 3.5 seconds. Students interpret x – intercepts in context.
c. Pettitte claims that his ball reached its maximum faster than Ryu’s. Is his claim correct or incorrect? Explain your answer.
Answer:
Pettitte’s claim is incorrect. It took both balls 1 second to reach their maximum heights. Students recognize that even though the vertex is different, both functions have the same axis of symmetry.
d. Find P(0) and R(0) values and explain what they mean in the problem. What conclusion can you make based on these values? Did Ryu and Pettitte throw their baseballs from the same height? Explain your answer.
Answer:
P(0) = 80 and R(0) = 86. Students interpret the y – intercept in context. Pettitte and Ryu threw their baseballs from 80 ft. and 86 ft. above the ground, respectively. They were throwing their baseballs from different initial heights.
e. Ryu claims that he can throw the ball higher than Pettitte. Is his claim correct or incorrect? Explain your answer.
Answer:
Ryu’s claim is incorrect. Even though Ryu’s ball reached maximum height of 102 ft., he started from higher above the ground. He was initially at 86 ft. above the ground. Ryu and Pettitte both threw the ball 16 ft. vertically from their initial positions. Students need to interpret the vertex value in relation to the y – intercept.
Eureka Math Algebra 1 Module 4 Lesson 10 Exit Ticket Answer Key
Question 1.
A toy company is manufacturing a new toy and trying to decide on a price that maximizes profit. The graph below represents profit (P) generated by each price of a toy (x). Answer the questions based on the graph of the quadratic function model.
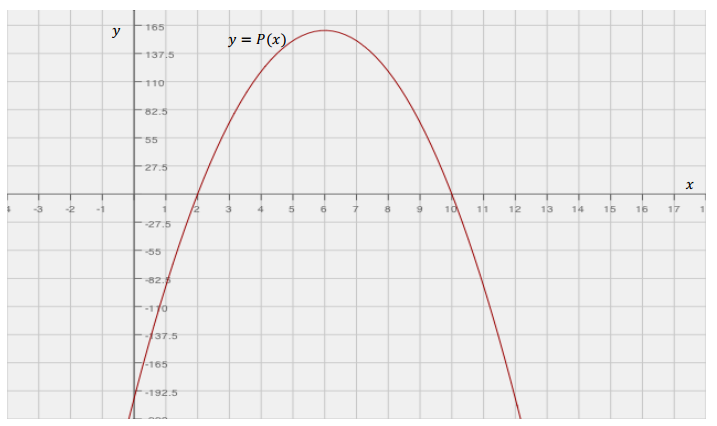
a. If the company wants to make a maximum profit, what should the price of a new toy be?
Answer:
$6
b. What is the minimum price of a toy that produces profit for the company? Explain your answer.
Answer:
The price of a toy must be more than $2 to generate a profit. $2 causes the company to break even and not make any profit.
c. Estimate the value of P(0), and explain what the value means in the problem and how this may be possible.
Answer:
P(0) is approximately – $192.50. Students should interpret an x – value of zero as the toy being given away for free. There is no way to say with certainty what the value P(0) = – 192.50 represents in this context because we do not know what assumptions were made about how many of the toys would be produced at each price point. We only know what the company concluded about their profit at each price point. It is quite likely that the model is only useful for the domain (2, 10) in this context.
d. If the company wants to make a profit of $137, for how much should the toy be sold?
Answer:
Approximately $4.50 or $7.50
e. Find the domain that only results in a profit for the company, and find its corresponding range of profit.
Answer:
Domain: (2, 10)
Range: (0, 160)
f. Choose the interval where the profit is increasing the fastest: [2, 3], [4, 5], [5.5, 6.5], [6, 7]. Explain your reasoning.
Answer:
The profit is increasing the fastest on the interval [2, 3]. The function’s rate increases fastest during the interval [2, 3]. It should be noted that the function increases and then decreases. However, the rate of change decreases reaching the rate of change of 0 at x = 6 and then increases.
g. The company owner believes that selling the toy at a higher price results in a greater profit. Explain to the owner how selling the toy at a higher price affects the profit.
Answer:
A higher priced toy does not necessarily make for a greater profit. The highest profit is produced when the toy is sold at $6, and then decreases if it is sold at a higher price than $6. Since this is a quadratic function, the profit only decreases after it reaches its maximum.