Engage NY Eureka Math Algebra 1 Module 3 Lesson 6 Answer Key
Eureka Math Algebra 1 Module 3 Lesson 6 Exercise Answer Key
Mathematical Modeling Exercise 1
Callie and Joe are examining the population data in the graphs below for a history report. Their comments are as follows:
Callie: It looks like the U.S. population grew the same amount as the world population, but that can’t be right, can it?
Joe: Well, I don’t think they grew by the same amount, but they sure grew at about the same rate. Look at the slopes.
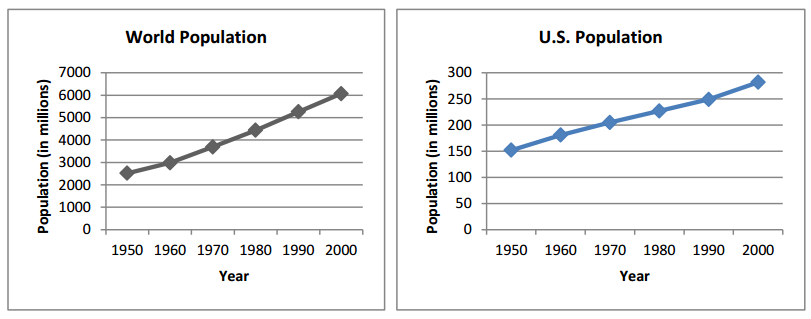
a. Is Callie’s observation correct? Why or why not?
Answer:
No, the world population grew by a far greater amount as shown by the scale of the vertical axis.
b. Is Joe’s observation correct? Why or why not?
Answer:
No, Joe ignored the scale, just as Callie did. The rate of change (or slope) is much greater for the world population than for the U.S. population.
c. Use the World Population graph to estimate the percent increase in world population from 1950 to 2000.
Answer:
Using 2,500 million for the year 1950 and 6,000 million for the year 2000 gives a percent increase of 140%, obtained by computing \(\frac{6000-2500}{2500}\).
d. Now, use the U.S. Population graph to estimate the percent increase in the U.S. population for the same time period.
Answer:
Using 150 million for the year 1950 and 280 million for the year 2000 gives a percent increase of 87%, obtained by computing \(\frac{280-150}{150}\).
e. How does the percent increase for the world population compare to that for the U.S. population over the same time period, 1950 to 2000?
Answer:
The world population was increasing at a faster average rate than the U.S. population was.
f. Do the graphs above seem to indicate linear or exponential population growth? Explain your response.
Answer:
In the time frame shown, the growth appears to be linear. The world population is increasing at an average rate of about 70 million per year (6000-2500 = 3500; \(\frac{3500}{50}\) = 70). The U.S. population is increasing at an average rate of about 2.6 million per year (280-150 = 130; \(\frac{130}{50}\) = 2.6).
g. Write an explicit formula for the sequence that models the world population growth from 1950 to 2000 based on the information in the graph. Assume that the population (in millions) in 1950 was 2,500 and in 2000 was 6,000. Use t to represent the number of years after 1950.
Answer:
f(t) = 70t + 2500
Mathematical Modeling Exercise 2
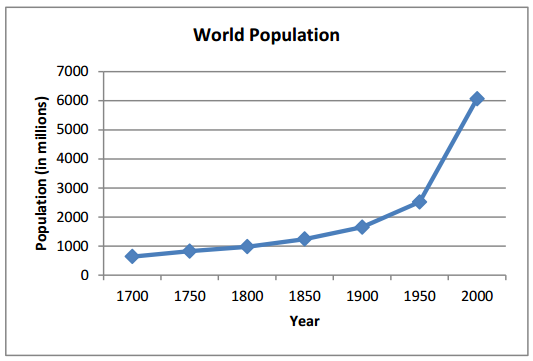
a. How is this graph similar to the World Population graph in Mathematical Modeling Exercise 1? How is it different?
Answer:
This graph uses the same vertical scale as the one for world population in Mathematical Modeling Exercise 1. This graph is different in two ways: (1) It shows years from A.D. 1700 through 2000 instead of from 1950 through 2000, and (2) the graph itself shows that population growth took an exponential turn in approximately 1850.
b. Does the behavior of the graph from 1950 to 2000 match that shown on the graph in Mathematical Modeling Exercise 1?
Answer:
Yes, both graphs show that the 1950 world population was about 2,500 million and that the 2000 world population was just over 6,000 million.
c. Why is the graph from Mathematical Modeling Exercise 1 somewhat misleading?
Answer:
The graph in Mathematical Modeling Exercise 1 makes it appear as if the world population has grown in a linear fashion when it has really grown exponentially if examined over a longer period of time.
d. An exponential formula that can be used to model the world population growth from 1950 through 2000 is as follows:
f(t) = 2519(1.0177)t
where 2,519 represents the world population in the year 1950, and t represents the number of years after 1950. Use this equation to calculate the world population in 1950, 1980, and 2000. How do your calculations compare with the world populations shown on the graph?
Answer:
1950—2,519; 1980—4,264; 2000—6,056. The amounts are similar to those shown on the graph.
e. The following is a table showing the world population numbers used to create the graphs above.
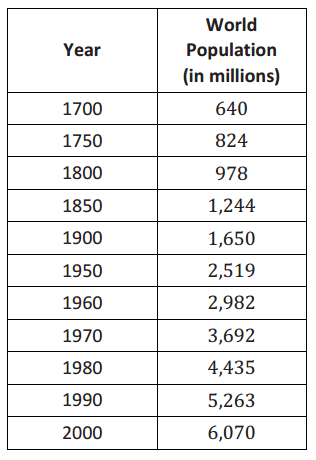
How do the numbers in the table compare with those you calculated in part (d) above?
Answer:
1950 is identical (since it was used as the base year); 1980 is reasonably close (4,264 vs. 4,435 million; about 3.9% variance); 2000 is very close (within 14 million; about 0.2% variance).
f. How is the formula in part (d) above different from the formula in Mathematical Modeling Exercise 1, part (g)? What causes the difference? Which formula more closely represents the population?
Answer:
The formula in Mathematical Modeling Exercise 1, part (g) is linear while the formula in part (d) above is exponential. The growth rate in the linear formula is a fixed 70 million increase in population each year whereas the growth rate in the exponential formula is a factor of 0.0177 or 1.77%. An exponential equation grows by a constant factor each year, while a linear equation grows by a constant difference each year. The exponential equation offers a more accurate model since the projected population numbers using this model more closely match the actual figures.
Exercises 1 – 2
Exercise 1.
The table below represents the population of the United States (in millions) for the specified years.
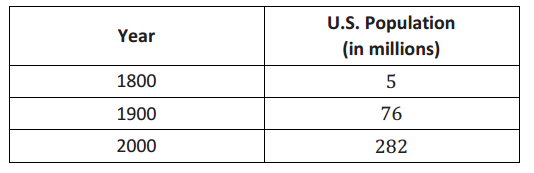
a. If we use the data from 1800 to 2000 to create an exponential equation representing the population, we generate the following formula for the sequence, where f(t) represents the U.S. population and t represents the number of years after 1800.
f(t) = 5(1.0204)t
Use this formula to determine the population of the United States in the year 2010.
Answer:
This formula yields a U.S. population of 347 million in 2010.
b. If we use the data from 1900 to 2000 to create an exponential equation that models the population, we generate the following formula for the sequence, where f(t) represents the U.S. population and t represents the number of years after 1900.
f(t) = 76(1.013)t
Use this formula to determine the population of the United States in the year 2010.
Answer:
This formula yields a U.S. population of 315 million in 2010.
c. The actual U.S. population in the year 2010 was 309 million. Which of the above formulas better models the U.S. population for the entire span of 1800 – 2010? Why?
Answer:
The formula in part (b) resulted in a closer approximation of the 2010 population. Although the population of the U.S. is still increasing exponentially, the rate has slowed considerably in the last few decades. Using the population from 1800 to 2000 to generate the formula results in a growth factor higher than the rate of the current population growth.
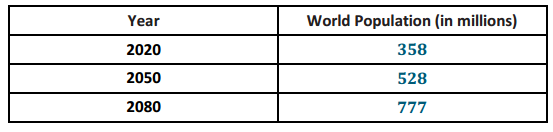
d. Complete the table below to show projected population figures for the years indicated. Use the formula from part (b) to determine the numbers.
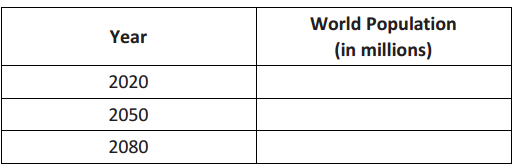
Answer:
e. Are the population figures you computed reasonable? What other factors need to be considered when projecting population?
Answer:
These numbers do not necessarily take into account changes in technology, efforts to reduce birth rates, food supply, or changes in life expectancy due to disease or scientific advances. Students may come up with a variety of responses.
Exercise 2.
The population of the country of Oz was 600,000 in the year 2010. The population is expected to grow by a factor of 5% annually. The annual food supply of Oz is currently sufficient for a population of 700,000 people and is increasing at a rate that will supply food for an additional 10,000 people per year.
a. Write a formula to model the population of Oz. Is your formula linear or exponential?
Answer:
P(t) = 600 000(1.05)t, with P(t) representing population and t representing years after 2010. The formula is exponential.
b. Write a formula to model the food supply. Is the formula linear or exponential?
Answer:
f(t) = 700 000 + 10000t, with f(t) representing the food supply in terms of number of people supplied with food and t representing the number of years after 2010. The equation is linear.
c. At what point does the population exceed the food supply? Justify your response.
Answer:
The population exceeds the food supply sometime during 2015. Students might use a table or a graph to support this response.
d. If Oz doubled its current food supply (to 1.4 million), would shortages still take place? Explain.
Answer:
Yes; the food supply would run out during the year 2031. Again, students may justify their responses using a graph or a table.
e. If Oz doubles both its beginning food supply and doubles the rate at which the food supply increases, would food shortages still take place? Explain.
Answer:
Yes; the food supply would run out in the year 2034. Students may justify with either a graph or a table.
Eureka Math Algebra 1 Module 3 Lesson 6 Problem Set Answer Key
Question 1.
Student Friendly Bank pays a simple interest rate of 2.5% per year. Neighborhood Bank pays a compound interest rate of 2.1% per year, compounded monthly.
a. Which bank will provide the largest balance if you plan to invest $10,000 for 10 years? For 20 years?
Answer:
Student Friendly Bank gives a larger balance at the 10-year mark. Neighborhood Bank gives a larger balance by the 20-year mark.
b. Write an explicit formula for the sequence that models the balance in the Student Friendly Bank account t years after a deposit is left in the account.
Answer:
S(t) = 10000 + 0.025(10000)t
c. Write an explicit formula for the sequence that models the balance in the Neighborhood Bank account m months after a deposit is left in the account.
Answer:
N(m) = 10000(1 + \(\frac{0.021}{12}\))m
d. Create a table of values indicating the balances in the two bank accounts from year 2 to year 20 in 2-year increments. Round each value to the nearest dollar.
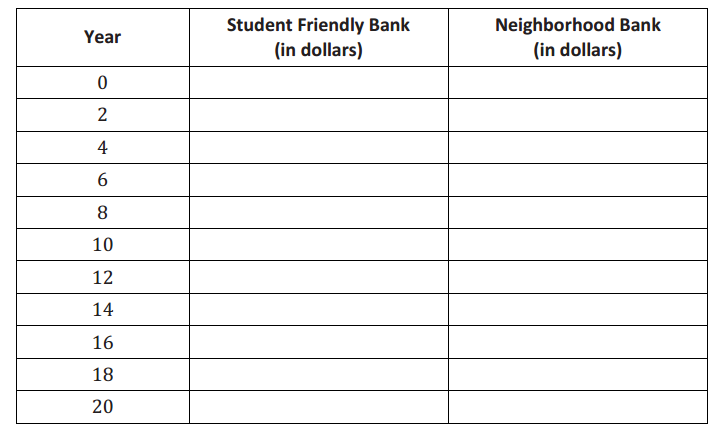
Answer:
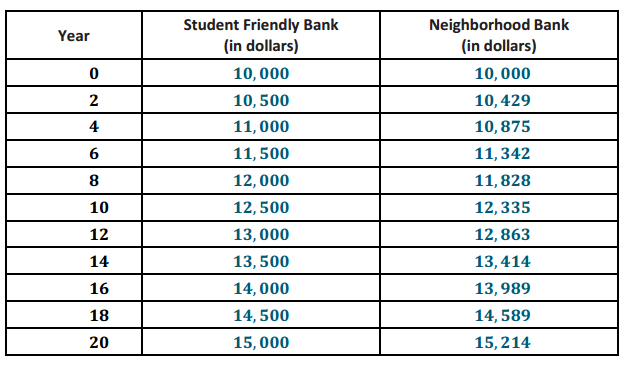
e. Which bank is a better short-term investment? Which bank is better for those leaving money in for a longer period of time? When are the investments about the same?
Answer:
Student Friendly Bank; Neighborhood Bank; they are about the same by the end of year 17.
f. What type of model is Student Friendly Bank? What is the rate or ratio of change?
Answer:
Linear; 0.025 per year
g. What type of model is Neighborhood Bank? What is the rate or ratio of change?
Answer:
Exponential; \(\frac{0.021}{12}\) per month
Question 2.
The table below represents the population of the state of New York for the years 1800 – 2000. Use this information to answer the questions.
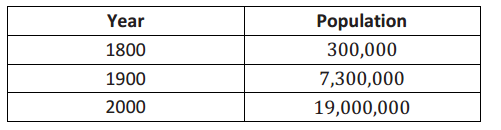
a. Using the year 1800 as the base year, an explicit formula for the sequence that models the population of New York is P(t) = 300 000(1.021)t, where t is the number of years after 1800. Using this formula, calculate the projected population of New York in 2010.
Answer:
23,579,093
b. Using the year 1900 as the base year, an explicit formula for the sequence that models the population of New York is P(t) = 7 300 000(1.0096)t, where t is the number of years after 1900. Using this formula, calculate the projected population of New York in 2010.
Answer:
20,880,960
c. Using the Internet (or some other source), find the population of the state of New York according to the 2010 census. Which formula yielded a more accurate prediction of the 2010 population?
Answer:
The actual population of the state of New York in 2010 was 19,200,000. The formula in part (b) resulted in a more accurate prediction.
Eureka Math Algebra 1 Module 3 Lesson 6 Exit Ticket Answer Key
Do the examples below require a linear or exponential growth model? State whether each example is linear or exponential, and write an explicit formula for the sequence that models the growth for each case. Include a description of the variables you use.
Question 1.
A savings account accumulates no interest but receives a deposit of $825 per month.
Answer:
Linear; f(t) = 825t, where f(t) represents the accumulated value in the account after t months
Question 2.
The value of a house increases by 1.5% per year.
Answer:
Exponential; f(t) = b(1.015)t, where b represents the beginning value of the house and f(t) is the value of the house after t years
Question 3.
Every year, the alligator population is \(\frac{9}{7}\) of the previous year’s population.
Answer:
Exponential; P(t) = c(\(\frac{9}{7}\))t, where c represents the current population of alligators and P(t) is the alligator population after t years
Question 4.
The temperature increases by 2° every 30 minutes from 8:00 a.m. to 3:30 p.m. each day for the month of July.
Answer:
Linear; T(t) = 2t + b, where b represents the beginning temperature and T(t) is the temperature after t half-hour periods since 8:00 a.m.
Question 5.
Every 240 minutes, \(\frac{1}{3}\) of the rodent population dies.
Answer:
Exponential; r(t) = p(\(\frac{2}{3}\))t, where p is the current population of rodents and r(t) is the remaining population of rodents after t four-hour periods