Engage NY Eureka Math Algebra 1 Module 3 Lesson 20 Answer Key
Eureka Math Algebra 1 Module 3 Lesson 20 Exploratory Challenge Answer Key
Exploratory Challenge 1
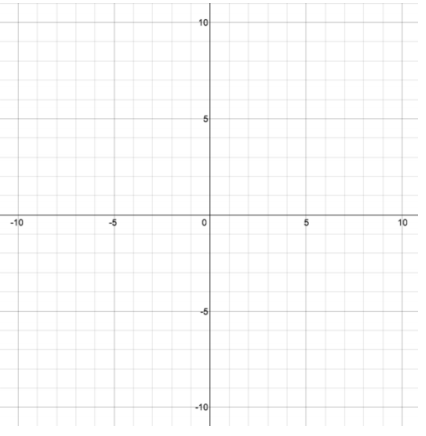
A transformation of the absolute value function f(x) = |x – 3| is rewritten here as a piecewise function. Describe in words how to graph this piecewise function.
Answer:
First, I would graph the line y = – x + 3 for x – values less than 3, and then I would graph the line y = x – 3 for x – values greater than or equal to 3.
Exploratory Challenge 2
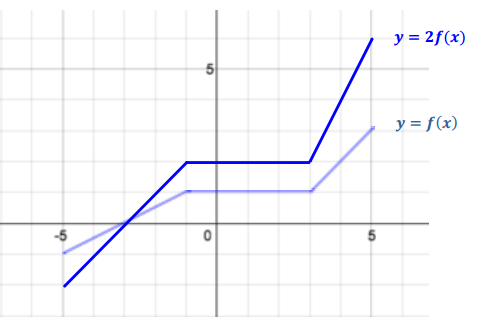
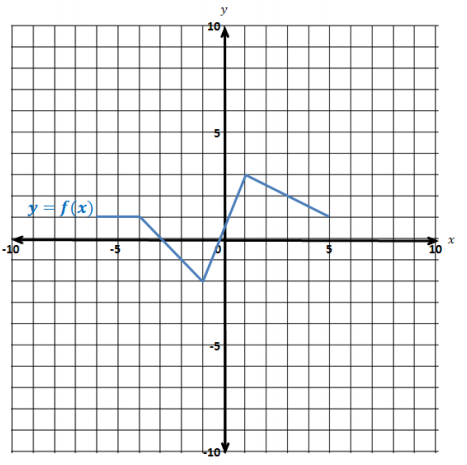
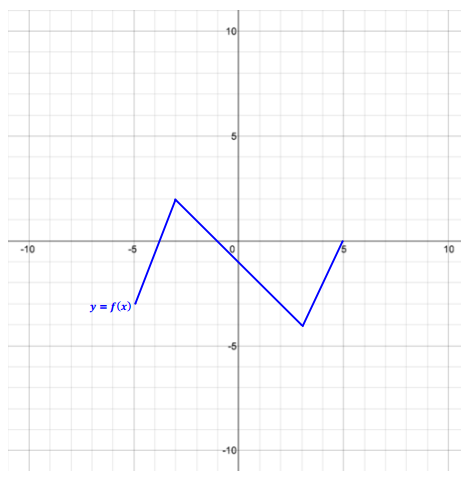
The graph y = f(x) of a piecewise function f is shown. The domain of f is – 5≤x≤5, and the range is – 1≤y≤3.
a. Mark and identify four strategic points helpful in sketching the graph of y = f(x).
Answer:
( – 5, – 1), ( – 1, 1), (3, 1), and (5, 3)
b. Sketch the graph of y = 2f(x), and state the domain and range of the transformed function. How can you use part (a) to help sketch the graph of y = 2f(x)?
Answer:
Domain: – 5≤x≤5, range: – 2≤y≤6. For every point (x, y) on the graph of y = f(x), there is a point (x, 2y) on the graph of y = 2f(x). The four strategic points can be used to determine the line segments in the graph of y = 2f(x) by graphing points with the same original x – coordinate and 2 times the original y – coordinate (( – 5, – 2), ( – 1, 2), (3, 2), and (5, 6)).
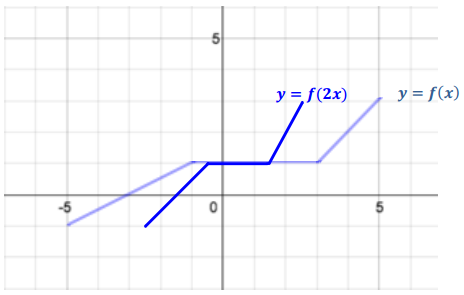
c. A horizontal scaling with scale factor \(\frac{1}{2}\) of the graph of y = f(x) is the graph of y = f(2x). Sketch the graph of y = f(2x), and state the domain and range. How can you use the points identified in part (a) to help sketch y = f(2x)?
Answer:
Domain: – 2.5≤x≤2.5, range: – 1≤y≤3. For every point (x, y) on the graph of y = f(x), there is a point (\(\frac{x}{2}\), y) on the graph of y = f(2x). The four strategic points can be used to determine the line segments in the graph of y = f(2x) by graphing points with one – half the original x – coordinate and the original y – coordinate (( – 2.5, – 1), ( – 0.5, 1), (1.5, 1), and (2.5, 3)).
Eureka Math Algebra 1 Module 3 Lesson 20 Exercise Answer Key
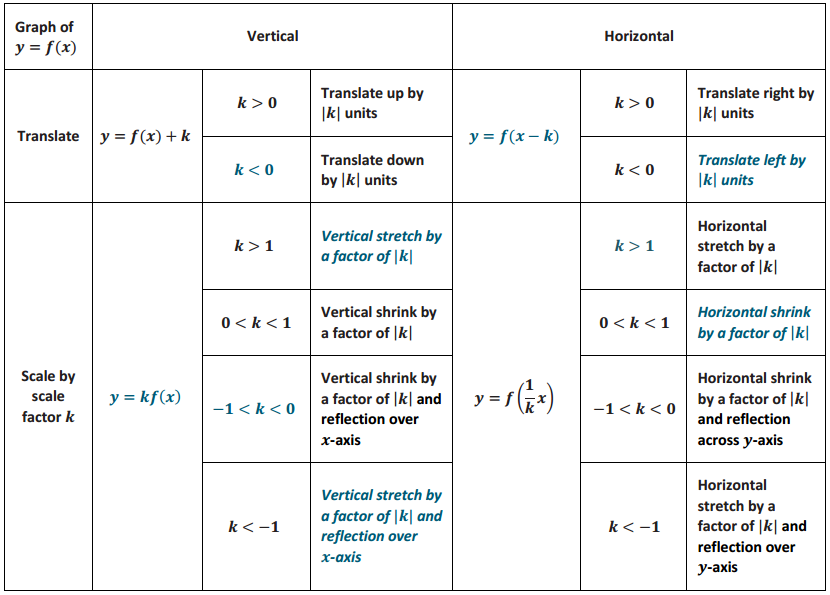
Opening Exercise
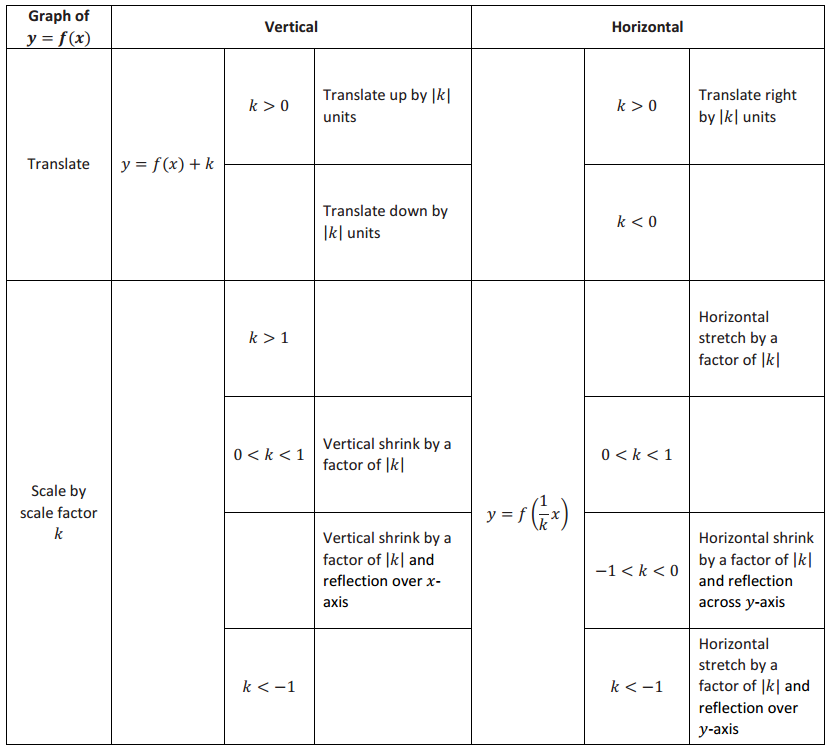
Fill in the blanks of the table with the appropriate heading or descriptive information.
Answer:
Exercises 1–2
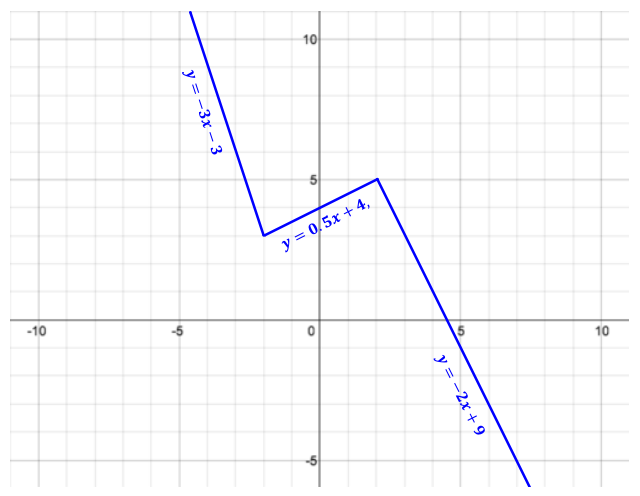
Exercise 1.
Describe how to graph the following piecewise function. Then, graph y = f(x) below.
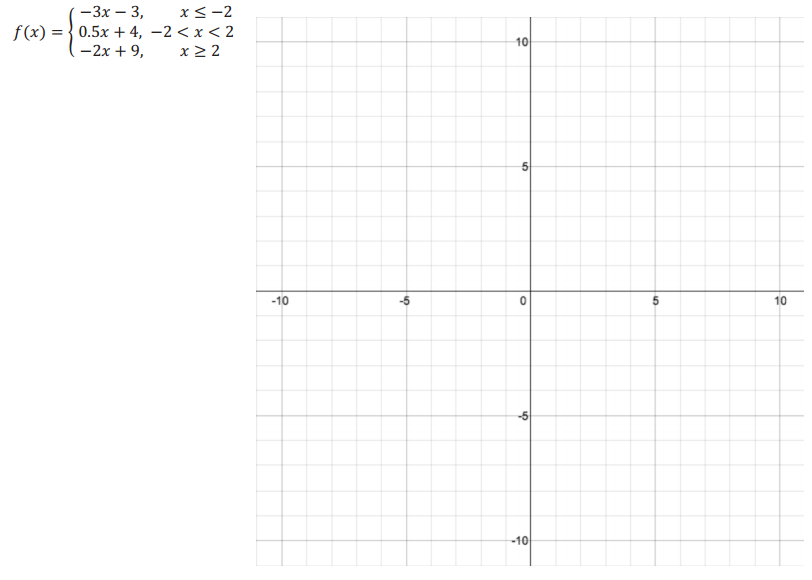
Answer:
The function f can be graphed of the line y = – 3x – 3 for x – values less than or equal to – 2, the graph of the line y = 0.5x + 4 for x – values greater than – 2 and less than 2, and the graph of the line y = – 2x + 9 for x – values greater than or equal to 2.
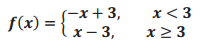
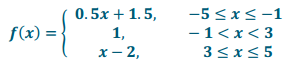
Exercise 2.
Using the graph of f below, write a formula for f as a piecewise function.
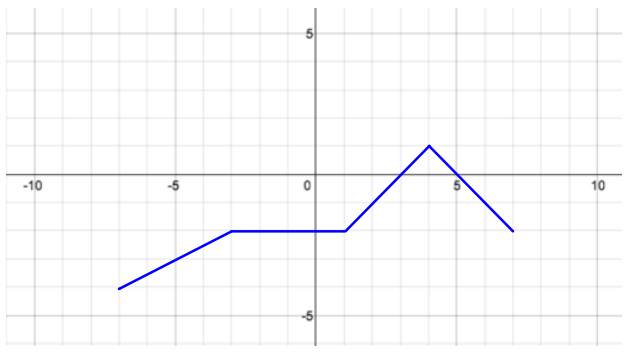
Answer:
Exercises 3–4
Exercise 3.
How does the range of f in Exploratory Challenge 2 compare to the range of a transformed function g, where g(x) = kf(x), when k>1?
Answer:
For every point (x, y) in the graph of y = f(x), there is a point (x, ky) in the graph of y = kf(x), where the number ky is a multiple of each y. For values of k > 1, y = kf(x) is a vertical scaling that appears to stretch the graph of y = f(x). The original range, – 1≤y≤3 for y = f(x) becomes – 1k≤y≤3k for the function y = kf(x).
Exercise 4.
How does the domain of f in Exploratory Challenge 2 compare to the domain of a transformed function g, where g(x) = f(\(\frac{1}{k}\) x), when 0<k<1? (Hint: How does a graph shrink when it is horizontally scaled by a factor k?)
Answer:
For every point (x, y) in the graph of y = f(x), there is a point (kx, y) in the graph of y = f(\(\frac{1}{k}\) x). For values of 0 < k < 1, y = f(\(\frac{1}{k}\) x) is a horizontal scaling by a factor k that appears to shrink the graph of y = f(x).
This means the original domain, – 5≤x≤5 for y = f(x), becomes – 5k≤x≤5k for the function y = f(\(\frac{1}{k}\) x).
Eureka Math Algebra 1 Module 3 Lesson 20 Problem Set Answer Key
Question 1.
Suppose the graph of f is given. Write an equation for each of the following graphs after the graph of f has been transformed as described. Note that the transformations are not cumulative.
a. Translate 5 units upward.
Answer:
y = f(x) + 5
b. Translate 3 units downward.
Answer:
y = f(x) – 3
c. Translate 2 units right.
Answer:
y = f(x – 2)
d. Translate 4 units left.
Answer:
y = f(x + 4)
e. Reflect about the x – axis.
Answer:
y = – f(x)
f. Reflect about the y – axis.
Answer:
y = f( – x)
g. Stretch vertically by a factor of 2.
Answer:
y = 2f(x)
h. Shrink vertically by a factor of \(\frac{1}{3}\).
Answer:
y = \(\frac{1}{3}\) f(x)
i. Shrink horizontally by a factor of \(\frac{1}{3}\).
Answer:
y = f(3x)
j. Stretch horizontally by a factor of 2.
Answer:
y = f(\(\frac{1}{2}\) x)
Question 2.
Explain how the graphs of the equations below are related to the graph of y = f(x).
a. y = 5f(x)
Answer:
The graph is a vertical stretch of y = f(x) by a factor of 5.
b. y = f(x – 4)
Answer:
The graph of y = f(x) is translated right 4 units.
c. y = – 2f(x)
Answer:
The graph is a vertical stretch of y = f(x) by a factor of 2 and reflected about the x – axis.
d. y = f(3x)
Answer:
The graph is a horizontal shrink of y = f(x) by a factor of \(\frac{1}{3}\).
e. y = 2f(x) – 5
Answer:
The graph is a vertical stretch of y = f(x) by a factor of 2 and translated down 5 units.
Question 3.
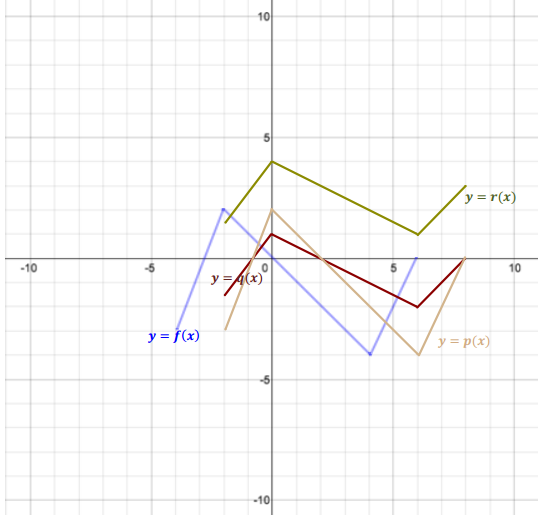
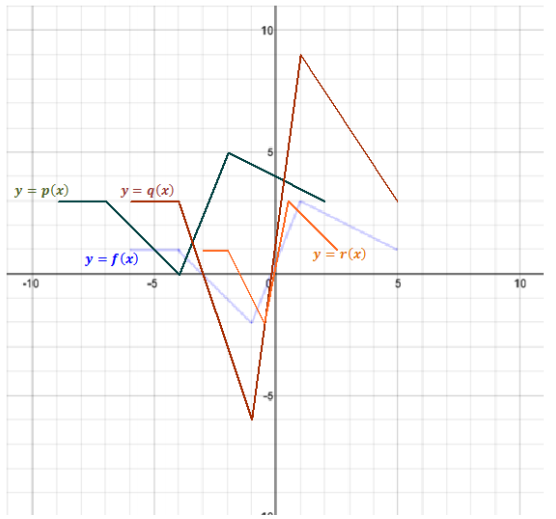
The graph of the equation y = f(x) is provided below. For each of the following transformations of the graph, write a formula (in terms of f) for the function that is represented by the transformation of the graph of y = f(x). Then, draw the transformed graph of the function on the same set of axes as the graph of y = f(x).
a. A translation 3 units left and 2 units up
Answer:
p(x) = f(x + 3) + 2
b. A vertical stretch by a scale factor of 3.
Answer:
q(x) = 3f(x)
c. A horizontal shrink by a scale factor of \(\frac{1}{2}\)
Answer:
r(x) = f(2x)
Question 4.
Reexamine your work on Exploratory Challenge 2 and Exercises 3 and 4 from this lesson. Parts (b) and (c) of Exploratory Challenge 2 asked how the equations y = 2f(x) and y = f(2x) could be graphed with the help of the strategic points found in part (a). In this problem, we investigate whether it is possible to determine the graphs of y = 2f(x) and y = f(2x) by working with the piecewise linear function f directly.
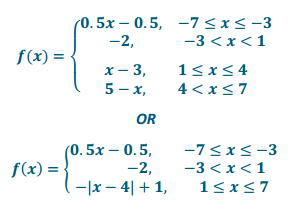
a. Write the function f in Exploratory Challenge 2 as a piecewise linear function.
Answer:
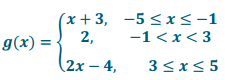
b. Let g(x) = 2f(x). Use the graph you sketched in Exploratory Challenge 2, part (b) of y = 2f(x) to write the formula for the function g as a piecewise linear function.
Answer:
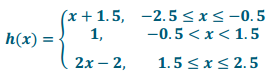
c. Let h(x) = f(2x). Use the graph you sketched in Exploratory Challenge 2, part (c) of y = f(2x) to write the formula for the function h as a piecewise linear function.
Answer:
d. Compare the piecewise linear functions g and h to the piecewise linear function f. Did the expressions defining each piece change? If so, how? Did the domains of each piece change? If so how?
Answer:
Function g: Each piece of the formula for g is 2 times the corresponding piece of the formula for f.
The domains are the same.
Function h: Each piece of the formula for h is found by substituting 2x in for x in the corresponding piece of the formula for f. The length of each interval in the domain of h is \(\frac{1}{2}\) the length of the corresponding interval in the domain of f.
Eureka Math Algebra 1 Module 3 Lesson 20 Exit Ticket Answer Key
Question 1.
The graph of a piecewise function f is shown below.
Let p(x) = f(x – 2), q(x) = \(\frac{1}{2}\) f(x – 2), and r(x) = \(\frac{1}{2}\) f(x – 2) + 3.
Graph y = p(x), y = q(x), and y = r(x) on the same set of axes as the graph of y = f(x).
Answer: