Engage NY Eureka Math Algebra 1 Module 3 Lesson 18 Answer Key
Eureka Math Algebra 1 Module 3 Lesson 18 Example Answer Key
Example
Let f(x) = |x|, g(x) = f(x – 3), and h(x) = f(x + 2), where x can be any real number.
a. Write the formula for g(x) in terms of |x| (i.e., without using f(x) notation).
Answer:
g(x) = |x – 3|
b. Write the formula for h(x) in terms of |x| (i.e., without using f(x) notation).
Answer:
h(x) = |x + 2|
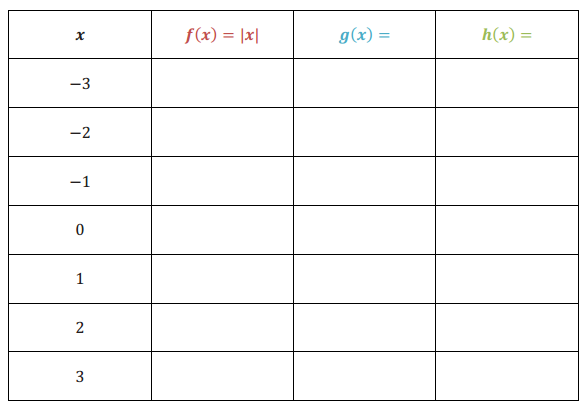
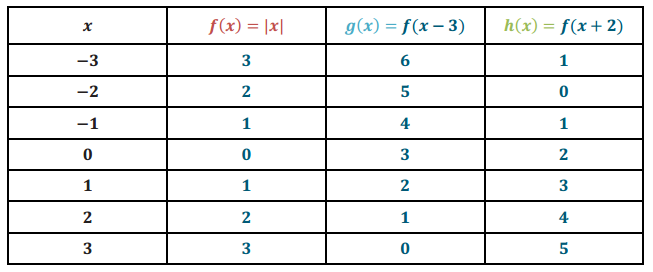
c. Complete the table of values for these functions.
Answer:
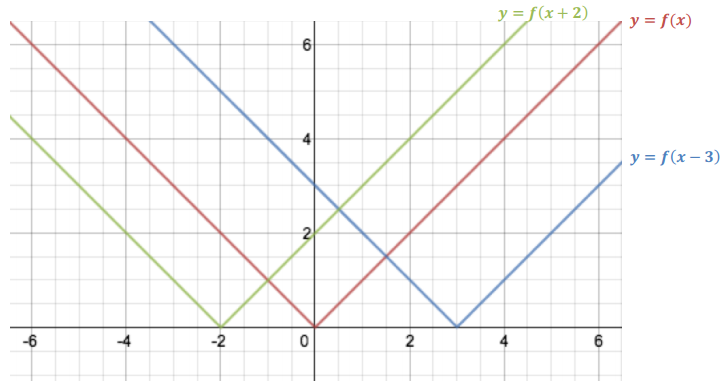
d. Graph all three equations: y = f(x), y = f(x – 3), and y = f(x + 2).
Answer:
e. How does the graph of y = f(x) relate to the graph of y = f(x – 3)?
Answer:
The graph of y = f(x – 3) is the graph of y = f(x) translated horizontally to the right 3 units.
f. How does the graph of y = f(x) relate to the graph of y = f(x + 2)?
Answer:
The graph of y = f(x + 2) is the graph of y = f(x) translated horizontally to the left 2 units.
g. How do the graphs of y = |x| – 3 and y = |x – 3| relate differently to the graph of y = |x|?
Answer:
The graph of y = |x| – 3 translates the graph of y = |x| down 3 units, whereas the graph of y = |x – 3| translates the graph of y = |x| to the right 3 units.
h. How do the values of g and h relate to the values of f?
Answer:
The input value for g has to be 3 more than the input value for f to get the same output values. The input value for h has to be two less than the input value for f to get the same output values.
Eureka Math Algebra 1 Module 3 Lesson 18 Exercise Answer Key
Exercises
Exercise 1.
Karla and Isamar are disagreeing over which way the graph of the function g(x) = |x + 3| is translated relative to the graph of f(x) = |x|. Karla believes the graph of g is “to the right” of the graph of f; Isamar believes the graph is “to the left.” Who is correct? Use the coordinates of the vertex of f and g to support your explanation.
Answer:
The graph of g is the graph of f translated to the left. The vertex of the graph of f is the point (0,0), whereas the vertex of the graph of g is the point ( – 3,0).
Exercise 2.
Let f(x) = |x|, where x can be any real number. Write a formula for the function whose graph is the transformation of the graph of f given by the instructions below.
a. A translation right 5 units
Answer:
a(x) = |x – 5|
b. A translation down 3 units
Answer:
b(x) = |x| – 3
c. A vertical scaling (a vertical stretch) with scale factor of 5
Answer:
c(x) = 5|x|
d. A translation left 4 units
Answer:
d(x) = |x + 4|
e. A vertical scaling (a vertical shrink) with scale factor of \(\frac{1}{3}\)
Answer:
e(x) = \(\frac{1}{3}\) |x|
Exercise 3.
Write the formula for the function depicted by the graph.
a. y =
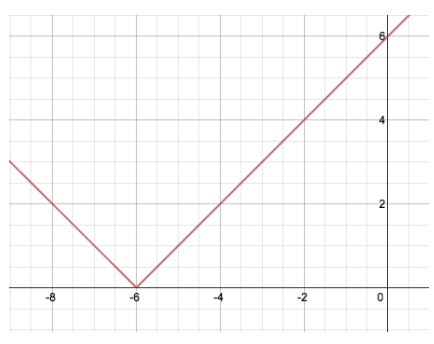
Answer:
|x + 6|
b. y =
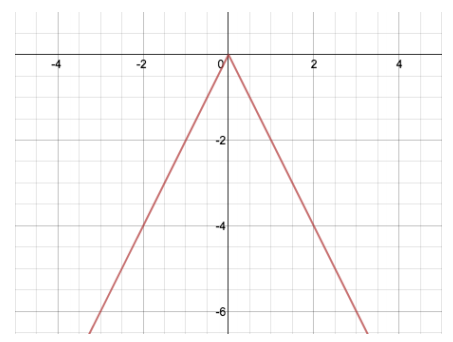
Answer:
– 2|x|
c. y =
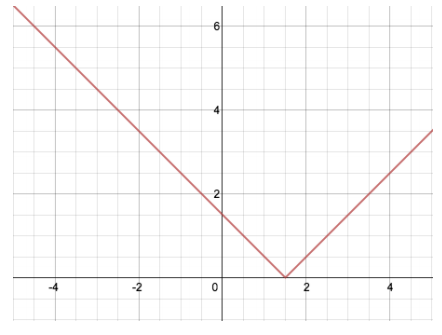
Answer:
|x – \(\frac{3}{2}\)|
d. y =
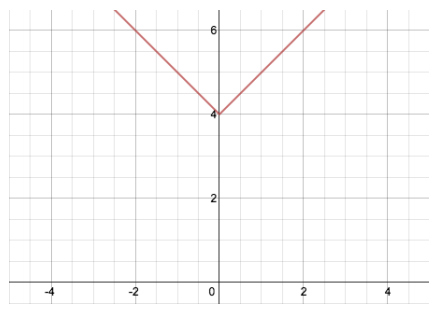
Answer:
|x| + 4
e. y =
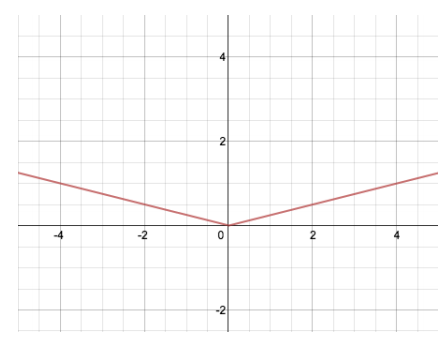
Answer:
\(\frac{1}{4}\)|x|
Exercise 4.
Let f(x) = |x|, where x can be any real number. Write a formula for the function whose graph is the described transformation of the graph of f.
a. A translation 2 units left and 4 units down
Answer:
y = |x + 2| – 4
b. A translation 2.5 units right and 1 unit up
Answer:
y = |x – 2.5| + 1
c. A vertical scaling with scale factor 1/2 and then a translation 3 units right
Answer:
y = \(\frac{1}{2}\)|x – 3|
d. A translation 5 units right and a vertical scaling by reflecting across the x – axis with vertical scale factor – 2
Answer:
y = – 2|x – 5|
Exercise 5.
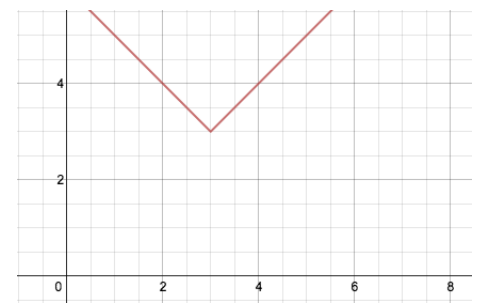
Write the formula for the function depicted by the graph.
a. y =
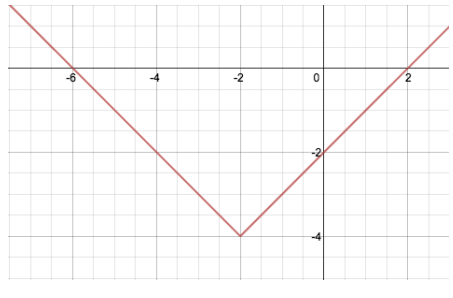
Answer:
|x + 2| – 4
b. y =
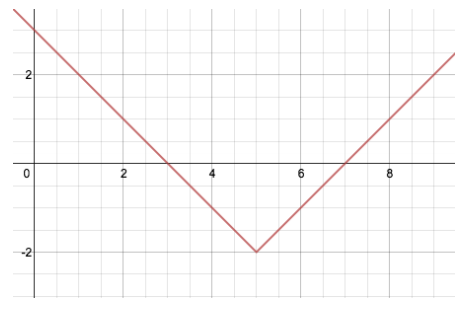
Answer:
|x – 5| – 2
c. y =
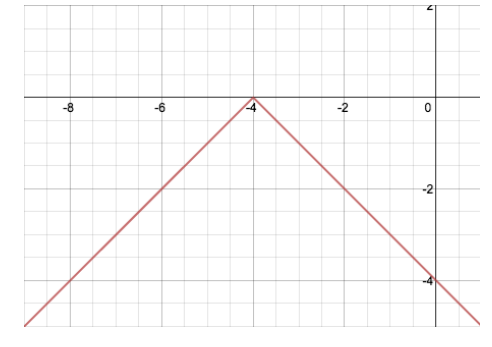
Answer:
– |x + 4|
d. y =
Answer:
|x – 3| + 3
Eureka Math Algebra 1 Module 3 Lesson 18 Problem Set Answer Key
Question 1.
Working with quadratic functions:
a. The vertex of the quadratic function f(x) = x2 is at (0,0), which is the minimum for the graph of f. Based on your work in this lesson, to where do you predict the vertex will be translated for the graphs of
g(x) = (x – 2)2 and h(x) = (x + 3)2?
Answer:
The vertex of g will be at (2,0). The vertex of h will be at ( – 3,0).
b. Complete the table of values, and then graph all three functions.
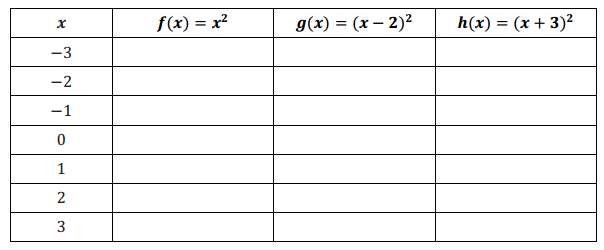
Answer:
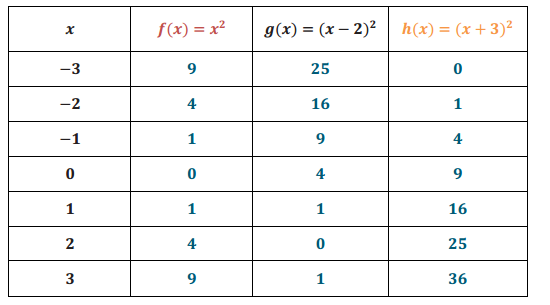
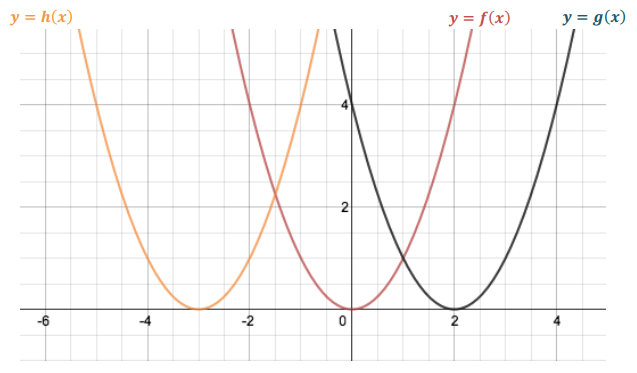
Question 2.
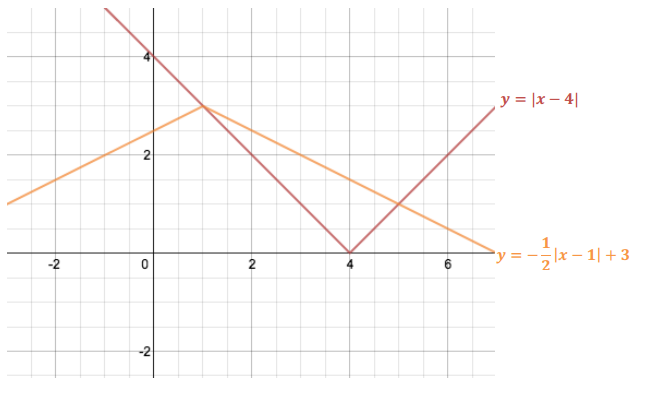
Let f(x) = |x – 4| for every real number x. The graph of the equation y = f(x) is provided on the Cartesian plane below. Transformations of the graph of y = f(x) are described below. After each description, write the equation for the transformed graph. Then, sketch the graph of the equation you write for part (d).
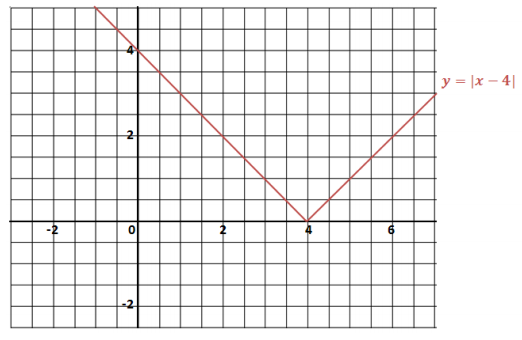
Answer:
a. Translate the graph left 6 units and down 2 units.
Answer:
y = |x + 2| – 2 or y = f(x + 2) – 2
b. Reflect the resulting graph from part (a) across the x – axis.
Answer:
y = – |x + 2| + 2 or y = – (f(x + 2) – 2)
c. Scale the resulting graph from part (b) vertically by a scale factor of \(\frac{1}{2}\).
Answer:
y = – \(\frac{1}{2}\) |x + 2| + 1 or y = – \(\frac{1}{2}\) (f(x + 2) – 2)
d. Translate the resulting graph from part (c) right 3 units and up 2 units. Graph the resulting equation.
Answer:
y = – \(\frac{1}{2}\) |x – 1| + 3 or y = – \(\frac{1}{2}\) (f(x – 1) – 2) + 2
Question 3.
Let f(x) = |x| for all real numbers x. Write the formula for the function represented by the described transformation of the graph of y = f(x).
a. First, a vertical stretch with scale factor \(\frac{1}{3}\) is performed, then a translation right 3 units, and finally a translation down 1 unit.
Answer:
a(x) = \(\frac{1}{3}\) |x – 3| – 1
b. First, a vertical stretch with scale factor 3 is performed, then a reflection over the x – axis, then a translation left 4 units, and finally a translation up 5 units.
Answer:
b(x) = – 3|x + 4| + 5
c. First, a reflection across the x – axis is performed, then a translation left 4 units, then a translation up 5 units, and finally a vertical stretch with scale factor 3.
Answer:
c(x) = 3( – |x + 4| + 5)
d. Compare your answers to parts (b) and (c). Why are they different?
Answer:
In part (c), the vertical stretch happens at the end, which means the graph resulting from the first three transformations is what is vertically stretched. In part (b), the graph is vertically stretched before the vertical translation. The graph of the function from part (b) has a vertex point at ( – 4,5); the graph of function from part (c) has a vertex point at ( – 4,15).
Question 4.
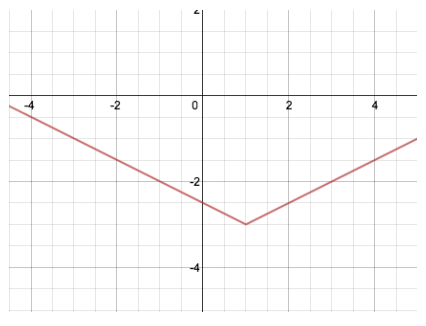
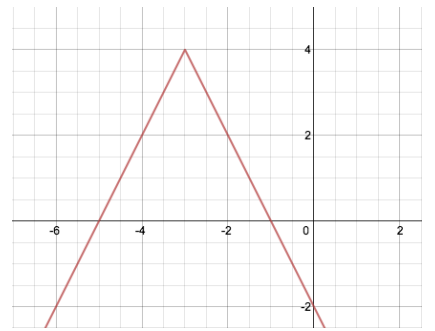
Write the formula for the function depicted by each graph.
a. a(x) =
Answer:
\(\frac{1}{2}\)|x – 1| – 3
b. b(x) =
Answer:
– 2|x + 3| + 4
Eureka Math Algebra 1 Module 3 Lesson 18 Exit Ticket Answer Key
Question 1.
Write the formula for the functions depicted by the graphs below:
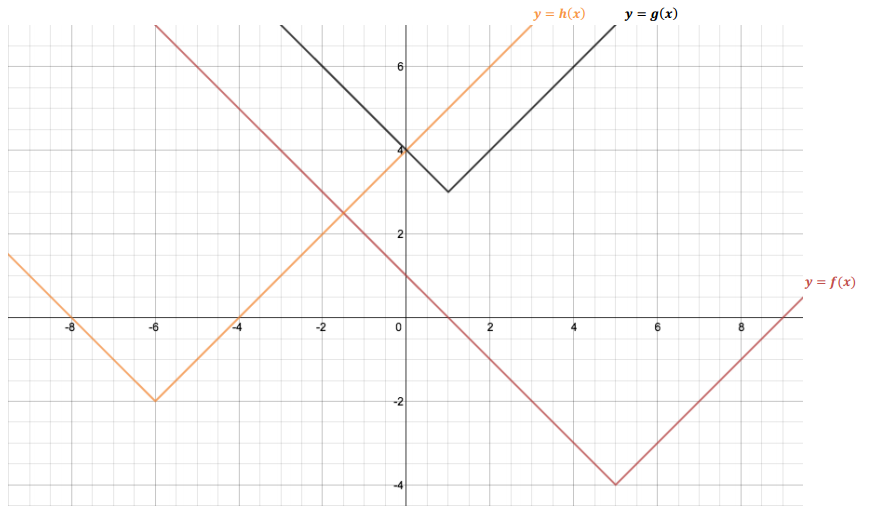
a. f(x) = ________________________________
Answer:
|x – 5| – 4
b. g(x) = ________________________________
Answer:
|x – 1| + 3
c. h(x) = ________________________________
Answer:
|x + 6| – 2