Engage NY Eureka Math Algebra 1 Module 3 Lesson 14 Answer Key
Eureka Math Algebra 1 Module 3 Lesson 14 Example Answer Key
Example 1.
Linear Functions
a. Sketch points P1 = (0, 4) and P2 = (4, 12). Are there values of m and b such that the graph of the linear function described by f(x) = mx + b contains P1 and P2? If so, find those values. If not, explain why they do not exist.
Answer:
The graph of the linear function contains (0, 4) when the y-intercept, b, is equal to 4. So all the linear functions whose graphs contain (0, 4) are represented by
f(x) = mx + 4, where m is a real number.
For the graph of f to also contain (4, 12),
12 = m(4) + 4
m = 2.
The linear function whose graph passes through (0, 4) and (4, 12) is
f(x) = 2x + 4.
b. Sketch P1 = (0, 4) and P2 = (0, -2). Are there values of m and b so that the graph of a linear function described by f(x) = mx + b contains P1 and P2? If so, find those values. If not, explain why they do not exist.
Answer:
For a function f, for each value of x, there can only be one f(x)-value. Therefore, there is no linear function f(x) = mx + b that contains P1 and P2 since each point has two different f(x) values for the same x-value.
Exponential Functions
Graphs (c) and (d) are both graphs of an exponential function of the form g(x) = abx . Rewrite the function g(x) using the values for a and b that are required for the graph shown to be a graph of g.
c. g(x) =
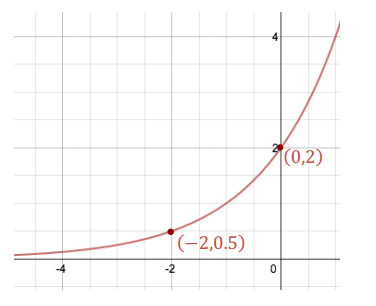
Answer:
g(x) = 2(2)x
d. g(x) =
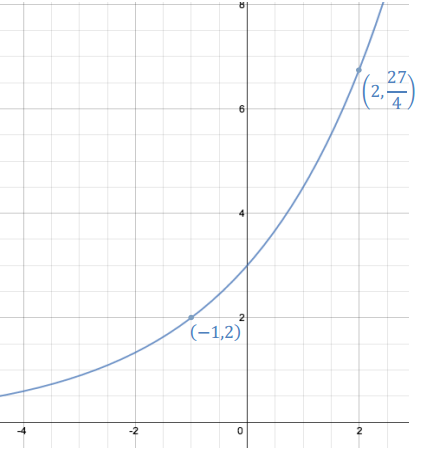
Answer:
g(x) = 3(\(\frac{3}{2}\))x
Example 2.
A lab researcher records the growth of the population of a yeast colony and finds that the population doubles every hour.
a. Complete the researcher’s table of data:
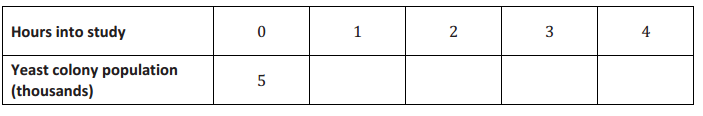
Answer:
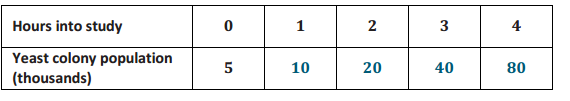
b. What is the exponential function that models the growth of the colony’s population?
Answer:
P(t) = 5(2)t
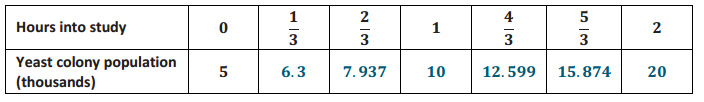
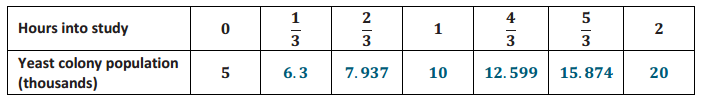
c. Several hours into the study, the researcher looks at the data and wishes there were more frequent measurements. Knowing that the colony doubles every hour, how can the researcher determine the population in half-hour increments? Explain.
Answer:
Let x represent the factor by which the population grows in half an hour. Since the population grows by the same factor in the next half hour, also x, the population will grow by x2 in 1 hour. However, the colony’s population doubles every hour:
x2 = 2
x = \(\sqrt{2}\)
The researcher should multiply the population by \(\sqrt{2}\) every half hour.
d. Complete the new table that includes half-hour increments.
Answer:
e. How would the calculation for the data change for time increments of 20 minutes? Explain.
Answer:
Now let x represent the factor by which the population grows in 20 minutes. Since the population grows by the same factor in the next 20 minutes and the 20 minutes after that, the population will grow by x3 in 1 hour. Since the colony’s population doubles every hour:
x3 = 2
x = \(\sqrt [ 3 ]{ 2 }\).
The researcher should multiply the population by \(\sqrt [ 3 ]{ 2 }\) every 20 minutes.
f. Complete the new table that includes 20-minute increments.
Answer:
g. The researcher’s lab assistant studies the data recorded and makes the following claim:
Since the population doubles in 1 hour, then half of that growth happens in the first half hour and the other half of that growth happens in the second half hour. We should be able to find the population at t = 1/2 by taking the average of the populations at t = 0 and t = 1.
Is the assistant’s reasoning correct? Compare this strategy to your work in parts (c) and (e).
Answer:
The assistant’s reasoning is not correct. By the assistant’s reasoning, the population growth at the first half-hour mark would be t(\(\frac{1}{2}\)) = 7.5 because then the population would have grown by 2.5 thousand cells from 5 thousand cells in the first half hour and another 2.5 thousand cells to 10 thousand cells in the second half hour. This is linear growth, or the same amount of population growth in each half hour. However, the percent growth by the assistant’s reasoning is 50% from t = 0 to t = 1 and 33% from t = 0 to t = 1.
For the population to double in 1 hour, there must be constant percent growth in each half hour.
Example 3.
A California Population Projection Engineer in 1920 was tasked with finding a model that predicts the state’s population growth. He modeled the population growth as a function of time, t years since 1900. Census data shows that the population in 1900, in thousands, was 1, 490. In 1920, the population of the state of California was 3, 554 thousand. He decided to explore both a linear and an exponential model.
a. Use the data provided to determine the equation of the linear function that models the population growth from 1900–1920.
Answer:
f(t) = 103.2t + 1490
b. Use the data provided and your calculator to determine the equation of the exponential function that models the population growth.
Answer:
g(t) = 1490(1.044)t
c. Use the two functions to predict the population for the following years:
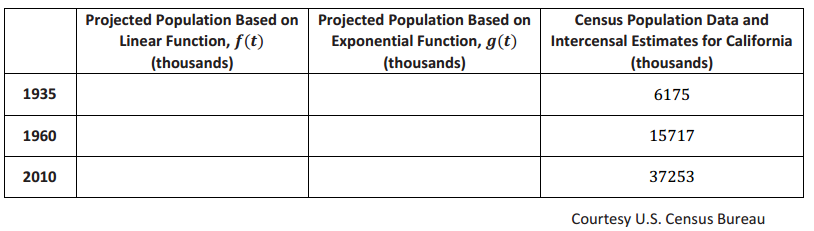
Answer:
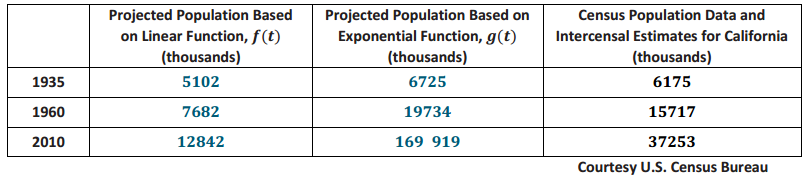
d. Which function is a better model for the population growth of California in 1935 and in 1960?
Answer:
The exponential model
e. Does either model closely predict the population for 2010? What phenomenon explains the real population value?
Answer:
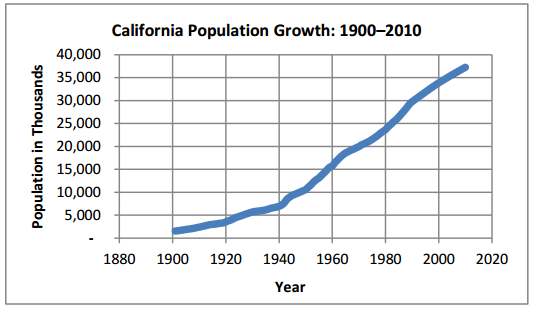
Neither model closely predicts the population. After a population boom from 1900–1960, the population growth slowed down. The following graph shows census and intercensal estimates for California’s population between 1900 and 2010.
Eureka Math Algebra 1 Module 3 Lesson 14 Problem Set Answer Key
Question 1.
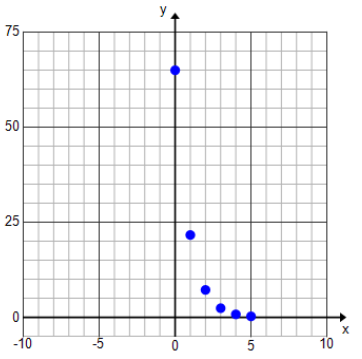
When a ball bounces up and down, the maximum height it reaches decreases with each bounce in a predictable way. Suppose for a particular type of squash ball dropped on a squash court, the maximum height, h(x),
after x number of bounces can be represented by h(x) = 65(\(\frac{1}{3}\))x.
a. How many times higher is the height after the first bounce compared to the height after the third bounce?
Answer:
9 times higher
b. Graph the points (x, h(x)) for x-values of 0, 1, 2, 3, 4, and 5.
Answer:
Question 2.
Australia experienced a major pest problem in the early 20th century. The pest? Rabbits. In 1859, 24 rabbits were released by Thomas Austin at Barwon Park. In 1926, there were an estimated 10 billion rabbits in Australia. Needless to say, the Australian government spent a tremendous amount of time and money to get the rabbit problem under control. (To find more on this topic, visit Australia’s Department of Environment and Primary Industries website under Agriculture.)
a. Based only on the information above, write an exponential function that would model Australia’s rabbit population growth.
Answer:
R(t) = 24(1.3448)t
b. The model you created from the data in the problem is obviously a huge simplification from the actual function of the number of rabbits in any given year from 1859 to 1926. Name at least one complicating factor (about rabbits) that might make the graph of your function look quite different than the graph of the actual function.
Answer:
Example: A drought could have wiped out a huge percentage of rabbits in a single year, showing a dip in the graph of the actual function.
Question 3.
After graduating from college, Jane has two job offers to consider. Job A is compensated at $100, 000 a year but with no hope of ever having an increase in pay. Jane knows a few of her peers are getting that kind of an offer right out of college. Job B is for a social media start-up, which guarantees a mere $10, 000 a year. The founder is sure the concept of the company will be the next big thing in social networking and promises a pay increase of 25% at the beginning of each new year.
a. Which job will have a greater annual salary at the beginning of the fifth year? By approximately how much?
Answer:
Job A, $100, 000 vs. $24, 400, a difference of about $75, 600
b. Which job will have a greater annual salary at the beginning of the tenth year? By approximately how much?
Answer:
Job A, $100, 000 vs. $74, 500, a difference of about $25, 500
c. Which job will have a greater annual salary at the beginning of the twentieth year? By approximately how much?
Answer:
Job B, $694, 000 vs. $100, 000, a difference of about $594, 000
d. If you were in Jane’s shoes, which job would you take?
Answer:
Answers may vary. Encourage students to voice reasons for each position. By the beginning of the twelfth year, Job B has a greater annual salary than Job A. After 17 years, Job B begins to have a bigger total financial payoff than Job A.
Question 4.
The population of a town in 2007 was 15, 000 people. The town has gotten its fresh water supply from a nearby lake and river system with the capacity to provide water for up to 30, 000 people. Due to its proximity to a big city and a freeway, the town’s population has begun to grow more quickly than in the past. The table below shows the population counts for each year from 2007–2012.
a. Write a function of x that closely matches these data points for x-values of 0, 1, 2, 3, 4, and 5.
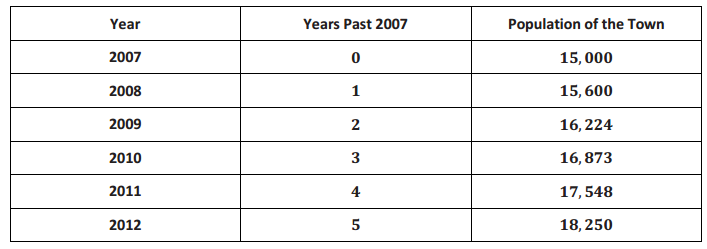
Answer:
The value of the ratio of population in one year to the population in the previous year appears to be the same for any two consecutive years in the table. The value of the ratio is 1.04, so a function that would model this data for x-values of 0, 1, 2, … , 5, is f(x) = 15, 000(1.04)x.
b. Assume the function is a good model for the population growth from 2012–2032. At what year during the time frame 2012–2032 will the water supply be inadequate for the population?
Answer:
If this model continues to hold true, the population will be larger than 30, 000 when x is 18, which corresponds to the year 2025.
Eureka Math Algebra 1 Module 3 Lesson 14 Exit Ticket Answer Key
Question 1.
A big company settles its new headquarters in a small city. The city council plans road construction based on traffic increasing at a linear rate, but based on the company’s massive expansion, traffic is really increasing exponentially.
What are the repercussions of the city council’s current plans? Include what you know about linear and exponential growth in your discussion.
Answer:
The city will not have the roads or capacity to handle the kind of traffic that will exist. Even if the linear growth of traffic initially outruns the exponential growth, eventually the exponential growth will catch up and exceed it. This means people will sit in traffic longer, and the city will be generally congested for longer than if it had been planned for much heavier traffic flow.