Engage NY Eureka Math Algebra 1 Module 3 Lesson 13 Answer Key
Eureka Math Algebra 1 Module 3 Lesson 13 Exercise Answer Key
Mathematical Modeling Exercise
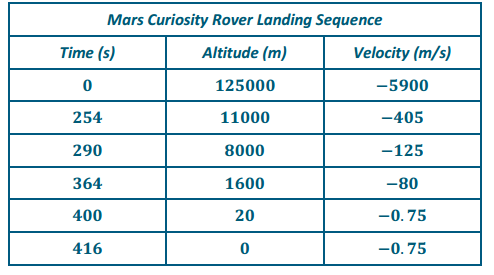
Create a model to help you answer the problem and estimate the altitude and velocity at various times during the landing sequence.
Answer:
As groups present their work, discuss the following questions.
→ How did you decide on your units? How did you decide on a scale?
→ Answers may vary.
→ Would it make sense to connect the points on the graphs? Why?
→ It would make sense because you could measure the velocity and altitude at any point in time during the landing sequence.
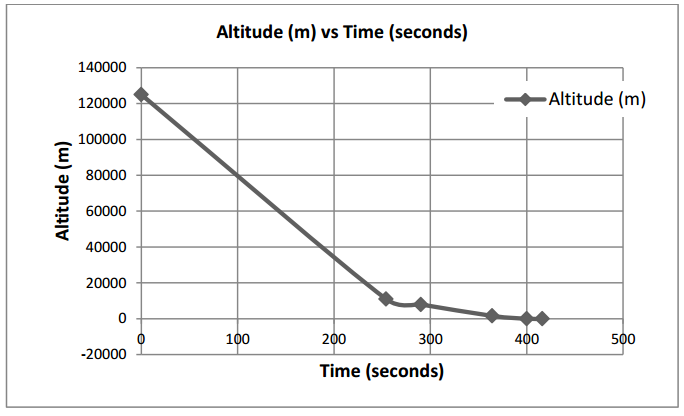
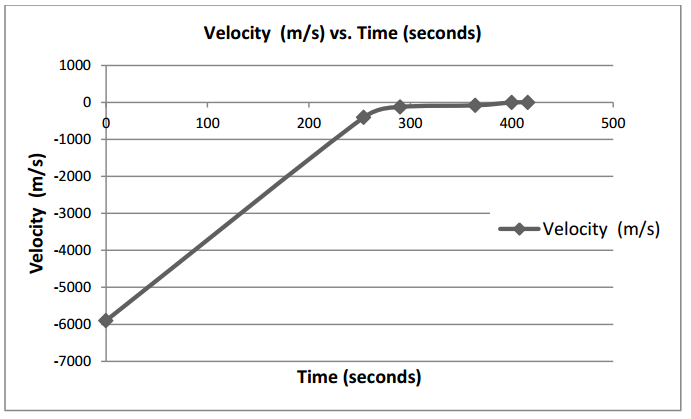
→ How would you describe the velocity graph? How would you describe the altitude graph?
The velocity graph appears below the t-axis, and it gets closer to the t-axis as time passes. The altitude gets closer to the t-axis as time passes.
Give groups time to refine their models after seeing how other groups solved this problem. Regardless of the presentation medium, make sure students are presenting accurate graphs and tables with variables named, axes scaled, and graphs labeled and titled. Sample graphs and tables are shown below. Additional samples are provided in the Exercises section.
Exercises
Exercise 1.
Does this graphic really represent the landing path of the Curiosity Rover?
Answer:
No, the height is not scaled appropriately in this graphic. According to the video it also looks as if the Curiosity Rover rises a bit when the parachute is released and when the sky crane engages.
Exercise 2.
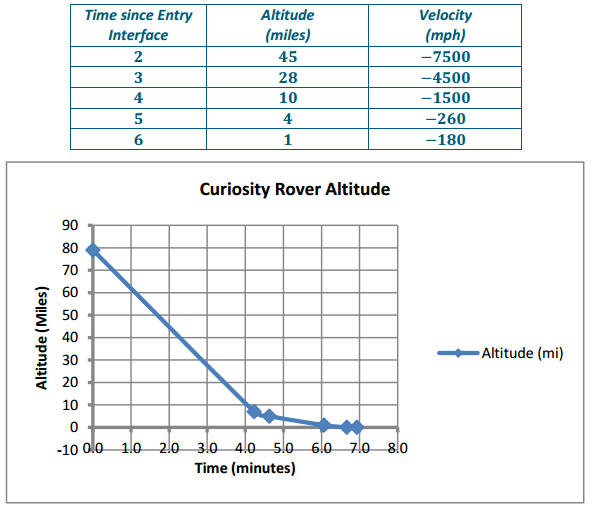
Estimate the altitude and velocity of the Curiosity Rover 5, 4, 3, 2, and 1 minute before landing. Explain how you arrived at your estimate.
Answer:
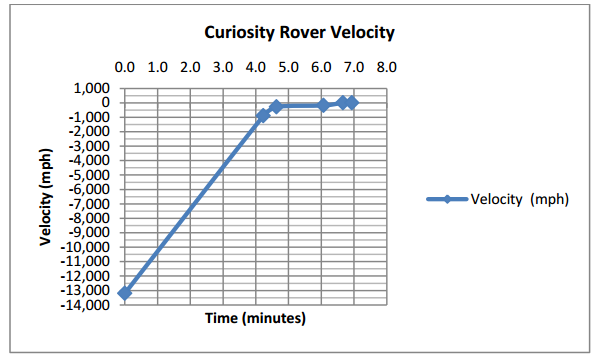
We used the graph and rounded the landing time to be at 7 minutes after entry interface. The table shows the altitude and velocity.
Exercise 3.
Based on watching the video/animation, do you think you need to revise any of your work? Explain why or why not, and then make any needed changes.
Answer:
Answers may vary. Some students might suggest that the period of rapid descent and deceleration cannot be linear. Some may suggest that their graphs take into account the period of upward motion when the parachute is released and the sky crane engages.
Exercise 4.
Why is the graph of the altitude function decreasing and the graph of the velocity function increasing on its domain?
Answer:
The altitude values are getting smaller as the time values are increasing. The velocity values are getting larger as the time values are increasing.
Exercise 5.
Why is the graph of the velocity function negative? Why does this graph not have a t-intercept?
Answer:
The graph is negative because we represent velocity as a negative quantity when the distance between two objects (in this case the Curiosity Rover and the surface of Mars) is decreasing. This graph does not have a t-intercept because the Curiosity Rover is traveling at -1.7 mph when it touches the surface of the planet.
Exercise 6.
What is the meaning of the t-intercept of the altitude graph? The y-intercept?
Answer:
The t-intercept is the time when the Curiosity Rover lands on the surface of Mars. The y-intercept is the height of the Curiosity Rover when Entry Interface begins.
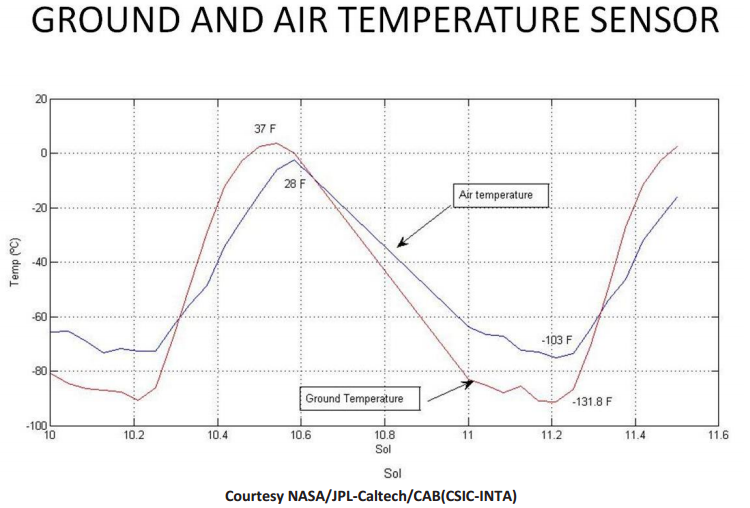
A Mars rover collected the following temperature data over 1.6 Martian days. A Martian day is called a sol. Use the graph to answer the following questions.
Exercise 7.
Approximately when does each graph change from increasing to decreasing? From decreasing to increasing?
Answer:
Increasing to decreasing: Air—approximately 10.18 and 10.59 Sol. Ground—approximately 10.52 and 11.12 Sol.
Decreasing to increasing: Air—approximately 10.12 Sol, 10.25 Sol, and 11.2 Sol. Ground—approximately 10.2, 11.1, and 11.2 Sol.
Exercise 8.
When is the air temperature increasing?
Answer:
Air temperature is increasing on the interval [10.12, 10.18], [10.25, 10.59], and [11.2, 11.5].
Exercise 9.
When is the ground temperature decreasing?
Answer:
Ground temperature is decreasing on the interval [10, 10.2], [10.55, 11.1], and [11.14, 11.2].
Exercise 10.
What is the air temperature change on this time interval?
Answer:
The high is 28°F and the low is -103°F. That is a change of 131°F. Students might also answer in Celsius units.
Exercise 11.
Why do you think the ground temperature changed more than the air temperature? Is that typical on earth?
Answer:
Student responses may vary.
Exercise 12.
Is there a time when the air and ground were the same temperature? Explain how you know.
Answer:
The air and ground temperature are the same at the following times: 10.3 Sol, 10.62 Sol, and 11.3 Sol.
Eureka Math Algebra 1 Module 3 Lesson 13 Problem Set Answer Key
Question 1.
Create a short written report summarizing your work on the Mars Curiosity Rover Problem. Include your answers to the original problem questions and at least one recommendation for further research on this topic or additional questions you have about the situation.
Answer:
Student responses may vary.
Question 2.
Consider the sky crane descent portion of the landing sequence.
a. Create a linear function to model the Curiosity Rover’s altitude as a function of time. What two points did you choose to create your function?
Answer:
Sample solution: For the function f, let f(t) represent the altitude, measured in meters, at time t, measured in seconds. The function, f(t)=-\(\frac{20}{16}\)(t-416) can be obtained by using the points (400, 20) and (416, 0) that are shown in the part of the diagram detailing the sky crane descent.
b. Compare the slope of your function to the velocity. Should they be equal? Explain why or why not.
Answer:
The slope of the linear function and velocity in the graphic are not equal. If we assume that the velocity is constant (which it is not), then they would be equal.
c. Use your linear model to determine the altitude one minute before landing. How does it compare to your earlier estimate? Explain any differences you found.
Answer:
The model predicts 75 m. The earlier estimate was 1 mile (1.6 km) and was close to a given data point. The model would only be a good predictor during the sky crane phase of landing.
Question 3.
The exponential function g(t) = 125(0.99)t could be used to model the altitude of the Curiosity Rover during its rapid descent. Do you think this model would be better or worse than the one your group created? Explain your reasoning.
Answer:
Answers may vary depending on the class graphs. It might be better because the Curiosity Rover did not descend at a constant rate, so a curve would make more sense than a line.
Question 4.
For each graph below, identify the increasing and decreasing intervals, the positive and negative intervals, and the intercepts.
Answer:
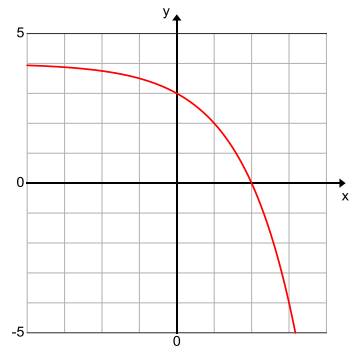
a. Decreasing interval [-4, 3.2], positive interval [-4, 2), negative interval (2, 3.2], y-intercept (0, 3), x-intercept (2, 0)
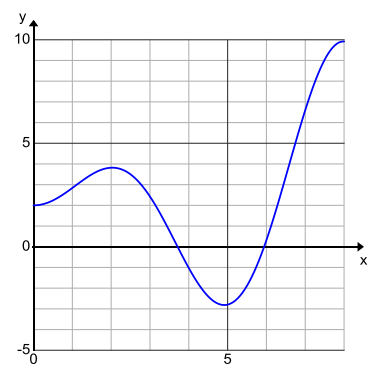
b. Increasing intervals [0, 2), (5, 8], decreasing interval [2, 5], positive intervals [0, 3.7), (6, 8], negative interval (3.7 , 6), y-intercept (0, 2), x-intercept (3.7, 0) and (6, 0)
Eureka Math Algebra 1 Module 3 Lesson 13 Exit Ticket Answer Key
Question 1.
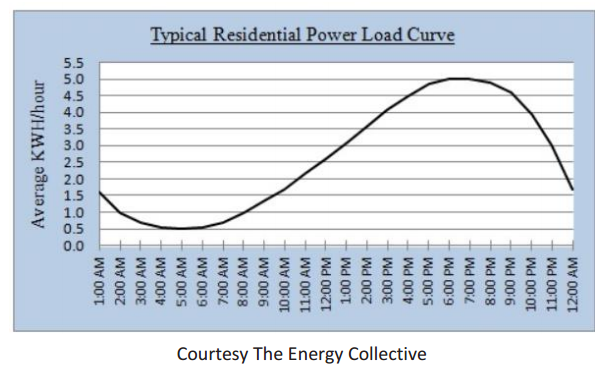
The following graph is a “power load curve” for typical U.S. residences. Estimate the time interval(s) when power use is typically decreasing. Why would power usage be decreasing during those time interval(s)?
Answer:
Power use is decreasing from 1:00 AM to 5:00 AM and from 7:00 PM to 12:00 AM. These are the times of day when people tend to be sleeping and therefore using less power than during waking hours.
Question 2.
On hot summer days energy use changes from decreasing to increasing and from increasing to decreasing more frequently than it does on other days. Why do you think this occurs?
Answer:
Perhaps people turn up the air when they leave the house during the day in order to conserve electricity and then turn down the air when they come home. They also may use a lower air setting or fans while sleeping which would cause an increase in power usage.