Engage NY Eureka Math Algebra 1 Module 2 Mid Module Assessment Answer Key
Eureka Math Algebra 1 Module 2 Mid Module Assessment Task Answer Key
Question 1.
The scores of three quizzes are shown in the following data plot for a class of 10 students. Each quiz has a maximum possible score of 10. Possible dot plots of the data are shown below.
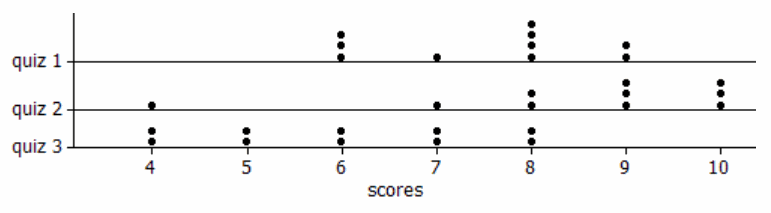
a. On which quiz did students tend to score the lowest? Justify your choice.
Answer:
Even though Quiz 2 had one low value, the bulk of the Quiz 3 scores are lower than the other quizzes. Therefore, students tended to score lowest on Quiz 3.
b. Without performing any calculations, which quiz tended to have the most variability in the students’ scores? Justify your choice based on the graphs.
Answer:
Quiz 3 tended to have the most variability in the students’ scores. The scores were over a wider range compared to the other two, which had a bit more clustering.
c. If you were to calculate a measure of variability for Quiz 2, would you recommend using the interquartile range or the standard deviation? Explain your choice.
Answer:
I would recommend the interquartile range because the very low Quiz 2 score will inflate the standard deviation.
d. For Quiz 3, move one dot to a new location so that the modified data set will have a larger standard deviation than before you moved the dot. Be clear which point you decide to move, where you decide to move it, and explain why.
Answer:
Move a dot from 8 to 9 to spread the scores out more.
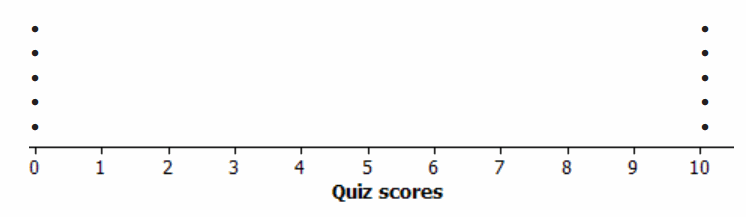
e. On the axis below, arrange 10 dots, representing integer quiz scores between 0 and 10 so that the standard deviation is the largest possible value that it may have. You may use the same quiz score values more than once.
Answer:
The dots are spread out from the center as much as possible, equally on both sides.
Use the following definitions to answer parts (f)–(h).
→ The midrange of a data set is defined to be the average of the minimum and maximum values:
\(\frac{\min +\max }{2}\).
→ The midhinge of a data set is defined to be the average of the first quartile (Q1) and the third quartile (Q3): \(\frac{Q_{1}+Q_{3}}{2}\).
f. Is the midrange a measure of center or a measure of spread? Explain.
Answer:
It is a measure of center because you are averaging two values and ending up in the middle.
g. Is the midhinge a measure of center or a measure of spread? Explain.
Answer:
It is a measure of center for the same reason given for part (f).
h. Suppose the lowest score for Quiz 2 was changed from 4 to 2, and the midrange and midhinge are recomputed. Which will change more?
A. Midrange
B. Midhinge
C. They will change the same amount.
D. Cannot be determined
Answer:
A. Midrange
Midrange will change more because you have changed the value of min but not Q.
Question 2.
The box plots below display the distributions of maximum speed for 145 roller coasters in the United States, separated by whether they are wooden coasters or steel coasters.
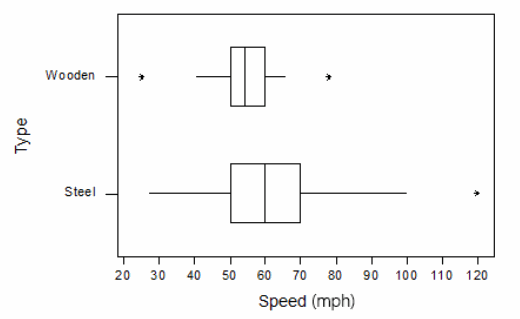
Based on the box plots, answer the following questions or indicate whether you do not have enough information.
a. Which type of coaster has more observations?
A. Wooden
B. Steel
C. About the same
D. Cannot be determined
Answer:
D. Cannot be determined
Explain your choice:
Answer:
We see how the values are split into pieces but not how many are in each piece.
b. Which type of coaster has a higher percentage of coasters that go faster than 60 mph?
A. Wooden
B. Steel
C. About the same
D. Cannot be determined
Answer:
B. Steel
Explain your choice:
Answer:
60 = median for steel → 50% faster
60 = Q3 for wood → 25% faster
c. Which type of coaster has a higher percentage of coasters that go faster than 50 mph?
A. Wooden
B. Steel
C. About the same
D. Cannot be determined
Answer:
C. About the same
Explain your choice:
Answer:
50 is Q for both, so both have above 75% going faster.
d. Which type of coaster has a higher percentage of coasters that go faster than 48 mph?
A. Wooden
B. Steel
C. About the same
D. Cannot be determined
Answer:
D. Cannot be determined
Explain your choice:
Answer:
The distributions do not land on one of the box edges, so I’m not sure what percent are faster than 48 mph.
e. Write 2–3 sentences comparing the two types of coasters with respect to which type of coaster normally goes faster.
Answer:
The median and Q3 are larger for steel coasters, so they tend to go faster. However, both types have about 25% slower than 50 mph. One steel coaster could even reach 120 mph.