Engage NY Eureka Math Algebra 1 Module 2 Lesson 19 Answer Key
Eureka Math Algebra 1 Module 2 Lesson 19 Example Answer Key
Example 1.
Positive and Negative Linear Relationships
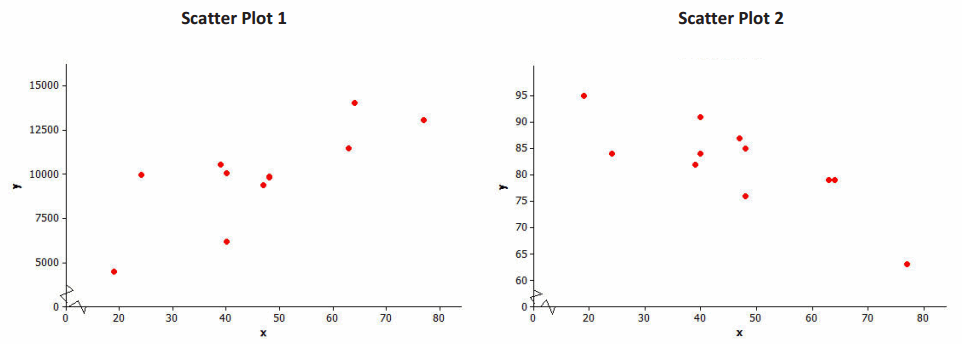
Linear relationships can be described as either positive or negative. Below are two scatter plots that display a linear relationship between two numerical variables x and y.
Example 2.
Some Linear Relationships Are Stronger than Others
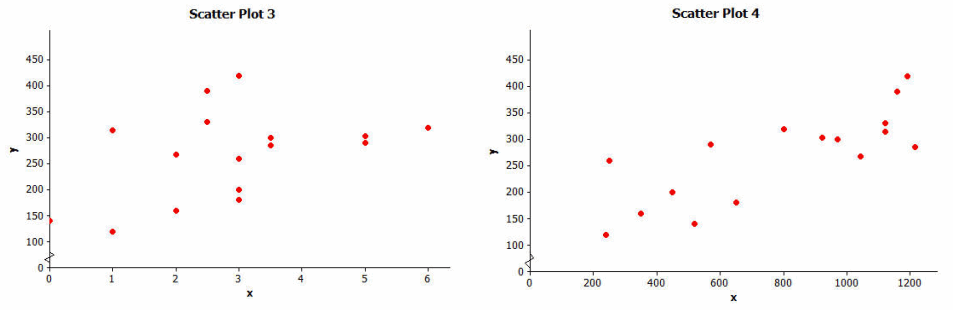
Below are two scatter plots that show a linear relationship between two numerical variables x and y.
Example 3:
The Correlation Coefficient
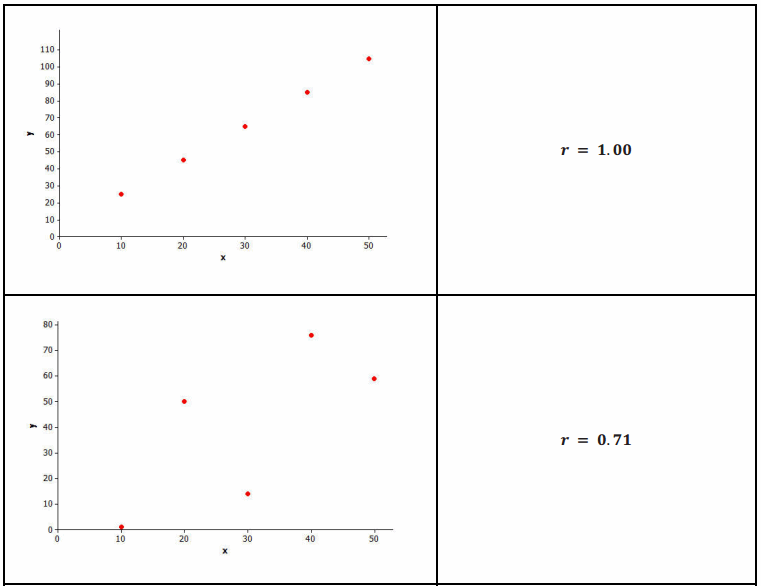
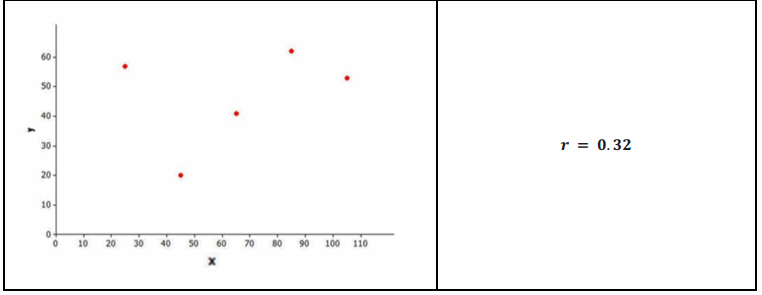
The correlation coefficient is a number between -1 and +1 (including -1 and +1) that measures the strength and direction of a linear relationship. The correlation coefficient is denoted by the letter r.
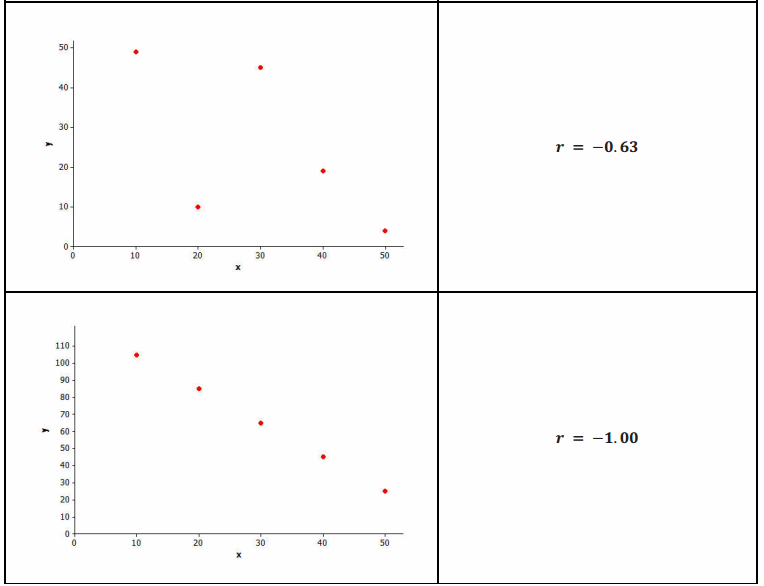
Several scatter plots are shown below. The value of the correlation coefficient for the data displayed in each plot is also given.
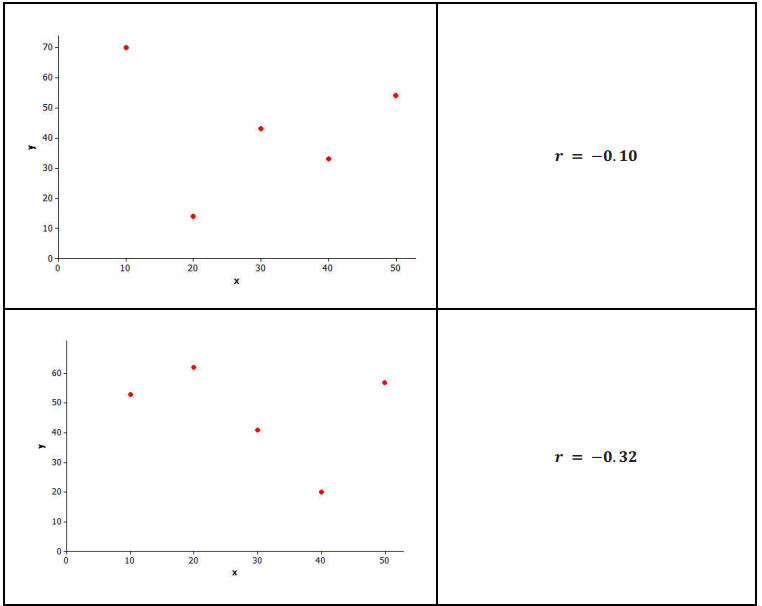
Example 4.
Calculating the Value of the Correlation Coefficient
There is an equation that can be used to calculate the value of the correlation coefficient given data on two numerical variables. Using this formula requires a lot of tedious calculations that are discussed in later grades. Fortunately, a graphing calculator can be used to find the value of the correlation coefficient once you have entered the data.
Your teacher will show you how to enter data and how to use a graphing calculator to obtain the value of the correlation coefficient.
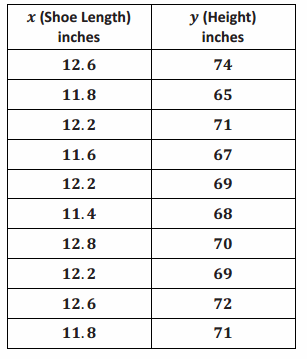
Here is the data from a previous lesson on shoe length in inches and height in inches for 10 men.
Example 5.
Correlation Does Not Mean There is a Cause-and-Effect Relationship Between Variables
It is sometimes tempting to conclude that if there is a strong linear relationship between two variables that one variable is causing the value of the other variable to increase or decrease. But you should avoid making this mistake. When there is a strong linear relationship, it means that the two variables tend to vary together in a predictable way, which might be due to something other than a cause-and-effect relationship.
For example, the value of the correlation coefficient between sodium content and number of calories for the fast food items in the previous example was r=0.79, indicating a strong positive relationship. This means that the items with higher sodium content tend to have a higher number of calories. But the high number of calories is not caused by the high sodium content. In fact, sodium does not have any calories. What may be happening is that food items with high sodium content also may be the items that are high in sugar or fat, and this is the reason for the higher number of calories in these items.
Similarly, there is a strong positive correlation between shoe size and reading ability in children. But it would be silly to think that having big feet causes children to read better. It just means that the two variables vary together in a predictable way. Can you think of a reason that might explain why children with larger feet also tend to score higher on reading tests?
→ Read through the last paragraph in the example and pose the question to students:
→ Can you think of a reason that might explain why children with larger feet also tend to score higher on reading tests?
→ As children get older, reading ability also tends to increase.
If students need more examples, discuss whether or not the following display a cause-and-effect relationship:
→ As the amount of time spent studying increases, so do SAT scores.
→ This is an example that is not a cause-and-effect relationship. Although the time of study might be associated to the SAT scores, the data are not collected from a statistical study that would investigate cause-and-effect. This should provoke an interesting discussion. While it could be argued that studying causes scores to increase, undoubtedly some do well without studying, and some may study a lot and still score poorly.
→ As the temperature increases in Florida, so do the number of shark attacks.
→ This may not be a cause-and-effect relationship because the temperature is not causing the sharks to attack people.
Eureka Math Algebra 1 Module 2 Lesson 19 Exercise Answer Key
Exercises 1–4
Exercise 1.
The relationship displayed in Scatter Plot 1 is a positive linear relationship. Does the value of the y-variable tend to increase or decrease as the value of x increases? If you were to describe this relationship using a line, would the line have a positive or negative slope?
Answer:
Increase; positive slope
Exercise 2.
The relationship displayed in Scatter Plot 2 is a negative linear relationship. As the value of one of the variables increases, what happens to the value of the other variable? If you were to describe this relationship using a line, would the line have a positive or negative slope?
Answer:
The other variable decreases; negative slope
Exercise 3.
What does it mean to say that there is a positive linear relationship between two variables?
Answer:
A positive linear relationship indicates that as the values of one variable increase, the values of the other variable also tend to increase.
Exercise 4.
What does it mean to say that there is a negative linear relationship between two variables?
Answer:
A negative linear relationship indicates that as the values of one variable increase, the values of the other variable tend to decrease.
Exercises 5–9
Exercise 5.
Is the linear relationship in Scatter Plot 3 positive or negative?
Answer:
Expect students to comment that this scatter plot is not as clear-cut as the previous examples. In general, there are more points in the scatter plot that describe a positive relationship.
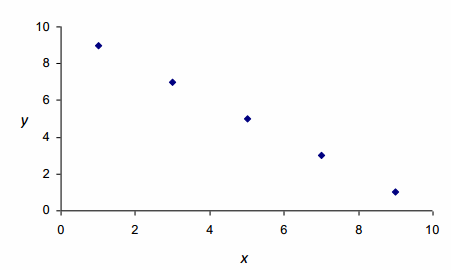
Exercise 6.
Is the linear relationship in Scatter Plot 4 positive or negative?
Answer:
This scatter plot also indicates a positive relationship. For most of the points, students note that as the x-values increase, the y-values also tend to increase.
Discuss Exercises 7–9 as a class. Allow for multiple responses.
It is also common to describe the strength of a linear relationship. We would say that the linear relationship in Scatter Plot 3 is weaker than the linear relationship in Scatter Plot 4.
Exercise 7.
Why do you think the linear relationship in Scatter Plot 3 is considered weaker than the linear relationship in Scatter Plot 4?
Answer:
Students should comment on the general scatter of the points. The points in Scatter Plot 3 are more scattered and do not cluster tightly around a line, while in Scatter Plot 4, the points conform more closely to a line.
Exercise 8.
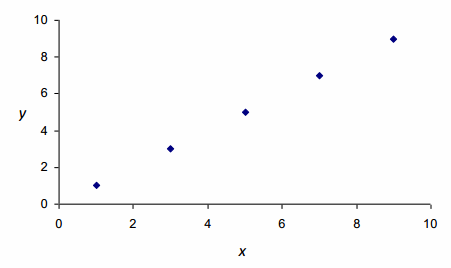
What do you think a scatter plot with the strongest possible linear relationship might look like if it is a positive relationship? Draw a scatter plot with five points that illustrates this.
Answer:
A scatter plot that has all of the points on a line with a positive slope indicates the strongest possible positive linear relationship. Students should draw points that form a line with a positive slope. See example below.
Exercise 9.
How would a scatter plot that shows the strongest possible linear relationship that is negative look different from the scatter plot that you drew in the previous question?
Answer:
A scatter plot with the strongest possible negative linear relationship would be one in which all of the points are on a line with a negative slope. This line has a negative slope, while the line drawn in Exercise 8 would have a positive slope.
Exercises 10–12: Strength of Linear Relationships
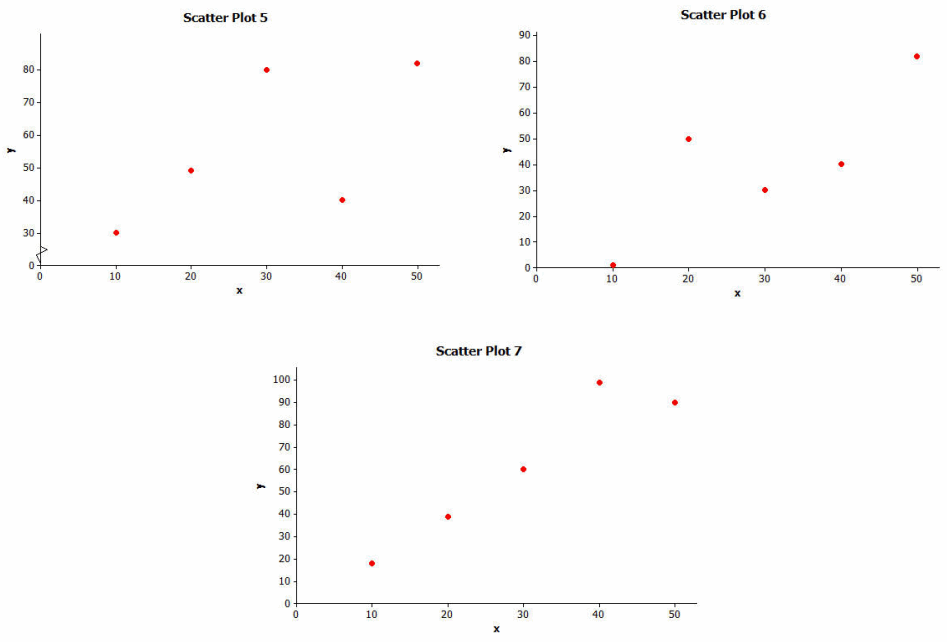
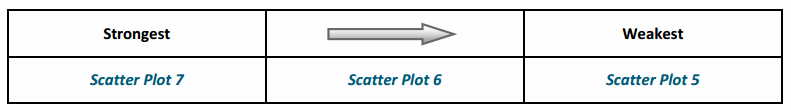
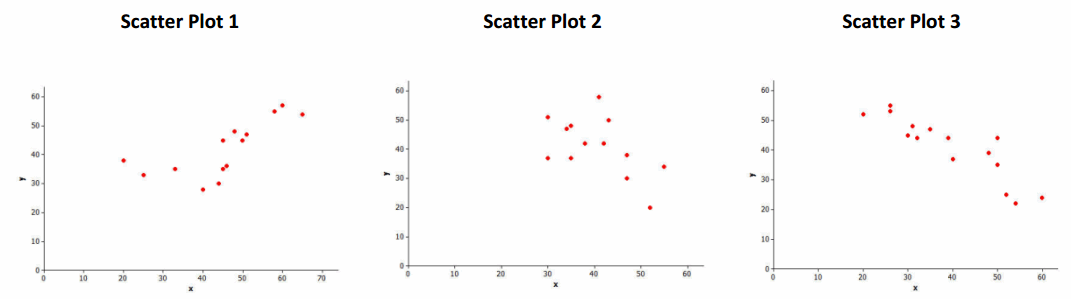
Exercise 10.
Consider the three scatter plots below. Place them in order from the one that shows the strongest linear relationship to the one that shows the weakest linear relationship.
Answer:
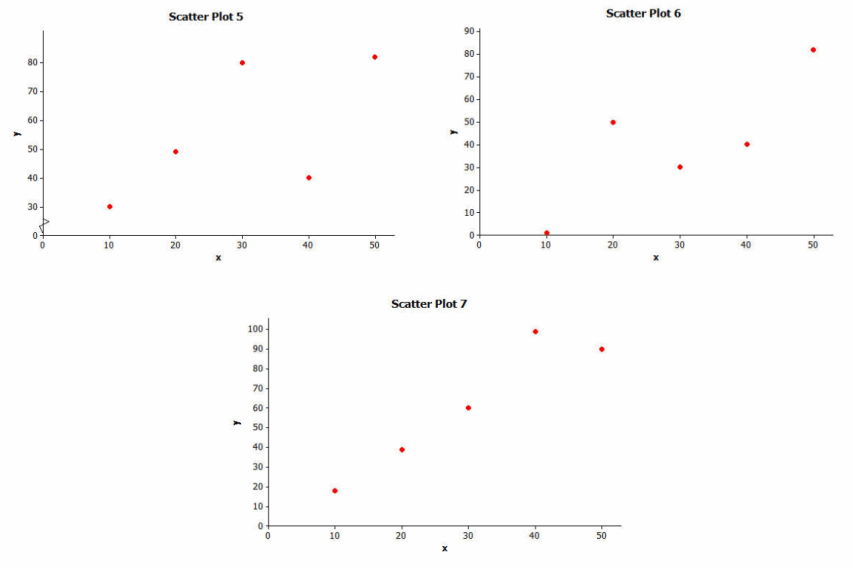
Exercise 11.
Explain your reasoning for choosing the order in Exercise 10.
Answer:
Students should imagine there is a least squares line in each plot. The strongest linear relationship has the smallest sum of the squares of the residuals while the weakest linear relationship has the largest sum of the squares of the residuals.
Exercise 12.
Which of the following two scatter plots shows the stronger linear relationship? (Think carefully about this one!)
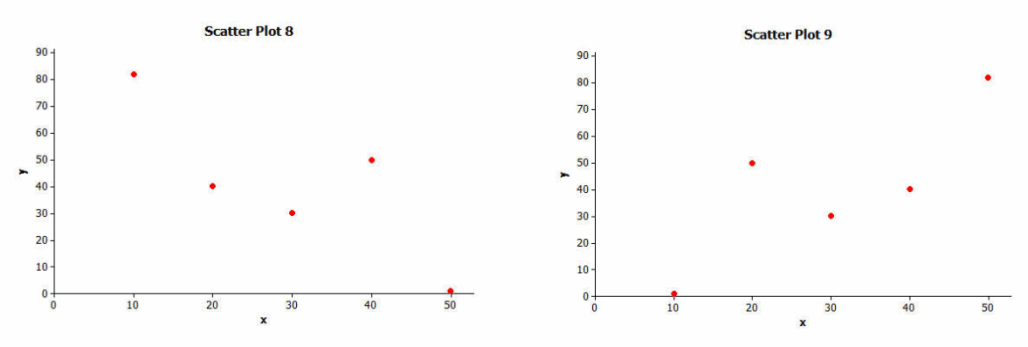
Answer:
The strength of the linear relationship is actually the same for each of these examples. The difference in the scatter plots, however, is that Scatter Plot 8 indicates a negative linear relationship, and Scatter Plot 9 indicates a positive relationship. (Note that it is important to discuss this response with students if the question is not answered correctly.)
Exercises 13–15
Exercise 13.
When is the value of the correlation coefficient positive?
Answer:
The correlation coefficient is positive when as the x-values increase, the y-values also tend to increase.
Exercise 14.
When is the value of the correlation coefficient negative?
Answer:
The correlation coefficient is negative when as the x-values increase, the y-values tend to decrease.
Exercise 15.
Is the linear relationship stronger when the correlation coefficient is closer to 0 or to 1 (or -1)?
Answer:
As the points form a stronger negative or positive linear relationship, the correlation coefficient gets farther from 0. Students note that when all of the points are on a line with a positive slope, the correlation coefficient is +1.
The correlation coefficient is -1 if all of the points are on a line with a negative slope.
Discuss the properties of the correlation coefficient with students. Find connections between the questions in this example and those properties.
Looking at the scatter plots in Example 4, you should have discovered the following properties of the correlation coefficient:
Property 1: The sign of r (positive or negative) corresponds to the direction of the linear relationship.
Property 2: A value of r=+1 indicates a perfect positive linear relationship, with all points in the scatter plot falling exactly on a straight line.
Property 3: A value of r=-1 indicates a perfect negative linear relationship, with all points in the scatter plot falling exactly on a straight line.
Property 4: The closer the value of r is to +1 or -1, the stronger the linear relationship.
Exercises 16–17
Exercise 16.
Enter the shoe length and height data in your calculator. Find the value of the correlation coefficient between shoe length and height. Round to the nearest tenth.
Answer:
Although it is not required to answer this question, you could encourage students to also examine the scatter plot of the data. The correlation coefficient is r≈0.6.
The table below shows how you can informally interpret the value of a correlation coefficient.
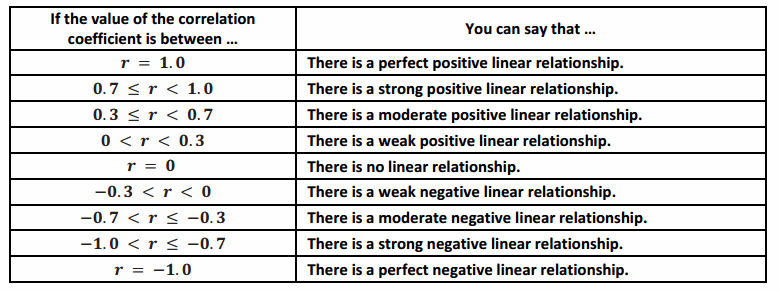
Exercise 17.
Interpret the value of the correlation coefficient between shoe length and height for the data given above.
Answer:
Based on the table, there is a moderate positive linear relationship. Connecting this to the scatter plot provides an example of a moderate positive linear relationship.
Exercises 18–24:
Practice Calculating and Interpreting Correlation Coefficients
Consumer Reports published a study of fast-food items. The table and scatter plot below display the fat content
(in grams) and number of calories per serving for 16 fast-food items.
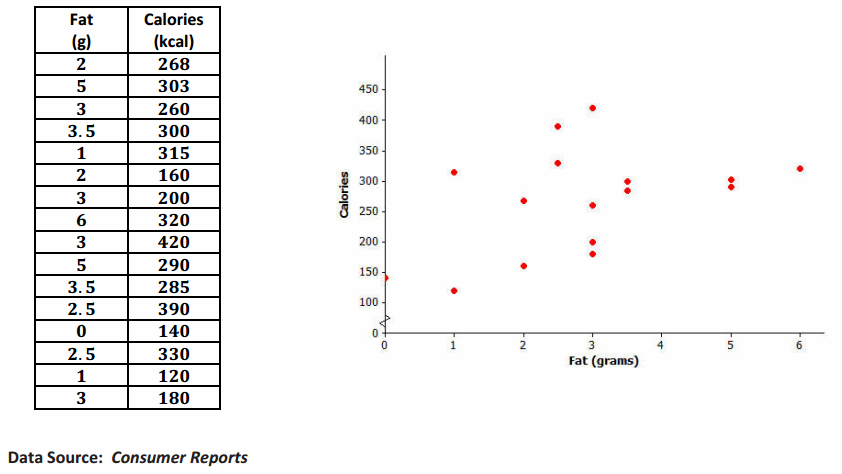
Exercise 18.
Based on the scatter plot, do you think that the value of the correlation coefficient between fat content and calories per serving will be positive or negative? Explain why you made this choice.
Answer:
Positive; the general pattern is that as the fat content increases, the number of calories tends to increase.
Exercise 19.
Based on the scatter plot, estimate the value of the correlation coefficient between fat content and calories.
Answer:
The scatter plot appears to have a positive correlation coefficient, but it also does not appear to be a strong relationship. As a result, students would indicate a moderate positive linear relationship and might predict a value between 0.3 and 0.7.
Exercise 20.
Calculate the value of the correlation coefficient between fat content and calories per serving. Round to the nearest hundredth. Interpret this value.
Answer:
The correlation coefficient is r≈0.44. It indicates a moderate positive linear relationship.
The Consumer Reports study also collected data on sodium content (in mg) and number of calories per serving for the same 16 fast food items. The data is represented in the table and scatter plot below.
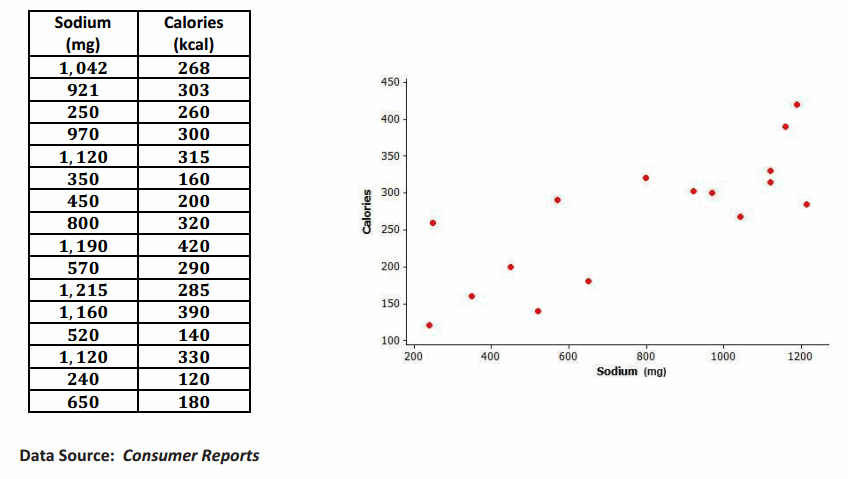
Exercise 21.
Based on the scatter plot, do you think that the value of the correlation coefficient between sodium content and calories per serving will be positive or negative? Explain why you made this choice.
Answer:
Positive; as the sodium content increases, the number of calories tends to increase.
Exercise 22.
Based on the scatter plot, estimate the value of the correlation coefficient between sodium content and calories per serving.
Answer:
This relationship appears to be stronger than the previous example. An estimate of the correlation coefficient is between 0.7 and 1.0.
Exercise 23.
Calculate the value of the correlation coefficient between sodium content and calories per serving. Round to the nearest hundredth. Interpret this value.
Answer:
The correlation coefficient is r≈0.79. By the table, this indicates a strong positive linear relationship between sodium content and calories.
Exercise 24.
For these 16 fast-food items, is the linear relationship between fat content and number of calories stronger or weaker than the linear relationship between sodium content and number of calories? Does this surprise you? Explain why or why not.
Answer:
The linear relationship is stronger for the sodium content and calories. Answers will vary as to whether or not this would surprise a student. It is anticipated that many students would think the fat was more strongly correlated to the number of calories. A summary to help explain this is provided in the next example.
If there is enough time, ask students:
→ Is there a connection between the slope of the least squares line and the value of the correlation coefficient, or r? If yes, what is the connection?
→ There is a connection regarding the sign of r (the correlation coefficient) and the sign of the slope if there is a linear relationship. If the least squares line is increasing, the slope is positive, and the value of the correlation coefficient, or r, is positive. If the least squares line is decreasing, then the slope is negative, and the value of the correlation coefficient is negative.
→ Why is it important to know if a relationship is strong or weak?
→ If a relationship is strong, then the data are close to the line, and the equation of the line can be used to predict values. If the relationship is weak, then the equation cannot be used as easily to predict values.
Eureka Math Algebra 1 Module 2 Lesson 19 Problem Set Answer Key
Question 1.
Which of the three scatter plots below shows the strongest linear relationship? Which shows the weakest linear relationship?
Answer:
The strongest linear relationship would be Scatter Plot 3. The weakest linear relationship would be Scatter Plot 2.
Question 2.
Consumer Reports published data on the price (in dollars) and quality rating (on a scale of 0 to 100) for 10 different brands of men’s athletic shoes.
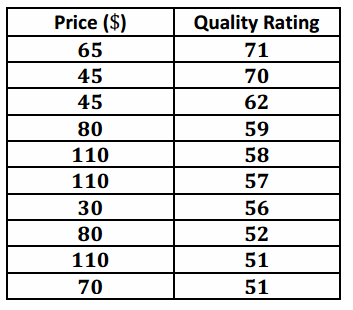
a. Construct a scatter plot of these data using the grid provided.
Answer:
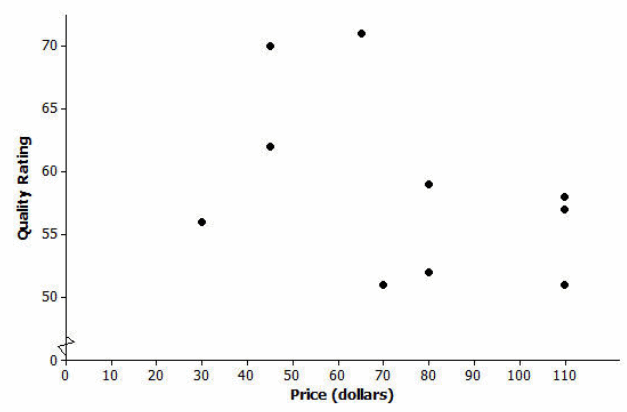
b. Calculate the value of the correlation coefficient between price and quality rating, and interpret this value. Round to the nearest hundredth.
Answer:
The correlation coefficient is r≈-0.42, using a TI-84. This indicates a moderate negative relationship between price and quality rating. It indicates that as the price increases, quality rating tends to decrease.
c. Does it surprise you that the value of the correlation coefficient is negative? Explain why or why not.
Answer:
It is anticipated that students will be surprised by this relationship. Students might think that as the price increases, the quality rating increases.
d. Is it reasonable to conclude that higher-priced shoes are higher quality? Explain.
Answer:
Based on this data, you would not necessarily assume that as the price increases, the quality tends to increase.
e. The correlation between price and quality rating is negative. Is it reasonable to conclude that increasing the price causes a decrease in quality rating? Explain.
Answer:
No, just because there is a correlation between two variables does not mean that there is a cause-and-effect relationship between the two.
Question 3.
The Princeton Review publishes information about colleges and universities. The data below are for six public 4-year colleges in New York. Graduation rate is the percentage of students who graduate within six years. Student-to-faculty ratio is the number of students per full-time faculty member.
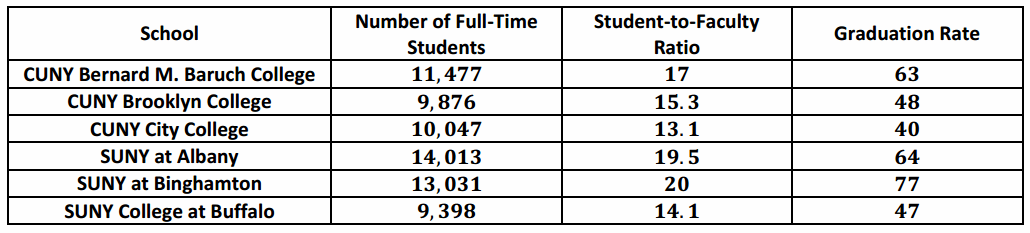
a. Calculate the value of the correlation coefficient between the number of full-time students and graduation rate. Round to the nearest hundredth.
Answer:
Let x represent the number of full-time students and y represent the graduation rate. The correlation coefficient is r≈0.83, using a TI-84.
b. Is the linear relationship between graduation rate and number of full-time students weak, moderate, or strong? On what did you base your decision?
Answer:
Based on the table presented in the lesson, the linear relationship between graduation rate and the number of full-time students is strong.
c. Is the following statement true or false? Based on the value of the correlation coefficient, it is reasonable to conclude that having a larger number of students at a school is the cause of a higher graduation rate.
Answer:
False; it is not reasonable to assume a cause-and-effect. There are other factors that might also contribute to higher graduation rates, including the student-to-faculty ratio and admission standards of the school.
d. Calculate the value of the correlation coefficient between the student-to-faculty ratio and the graduation rate. Round to the nearest hundredth.
Answer:
Let x represent the student-to-faculty ratio and y represent the graduation rate. The correlation coefficient is
r≈0.95, using a TI-84.
e. Which linear relationship is stronger: graduation rate and number of full-time students or graduation rate and student-to-faculty ratio? Justify your choice.
Answer:
The stronger relationship is between graduation rate and student-to-faculty ratio. The correlation coefficient is greater in this case.
Eureka Math Algebra 1 Module 2 Lesson 19 Exit Ticket Answer Key
The scatter plot below displays data on the number of defects per 100 cars and a measure of customer satisfaction
(on a scale from 1 to 1,000, with higher scores indicating greater satisfaction) for the 33 brands of cars sold in the
United States in 2009.
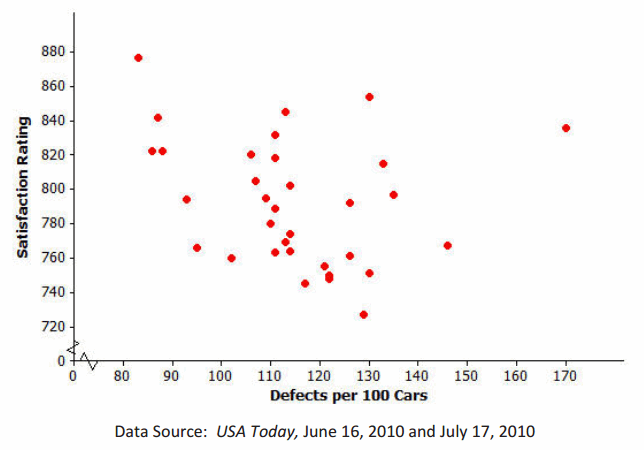
a. Which of the following is the value of the correlation coefficient for this data set: r=-0.95, r=-0.24, r=0.83, or r=1.00?
Answer:
r=-0.24
b. Explain why you selected this value.
Answer:
Students’ answers should indicate that there is not a strong pattern of a linear relationship with this scatter plot. Students may struggle with an explanation based on weak relationship; however, there is a general pattern that as the number of defects increase, the satisfaction rating tends to decrease. As a result, students would estimate a weak negative association or a negative value of r close to zero. Based on the values provided, students would estimate r=-0.24.