Engage NY Eureka Math Algebra 1 Module 2 Lesson 18 Answer Key
Eureka Math Algebra 1 Module 2 Lesson 18 Example Answer Key
Example 1.
The Relevance of the Pattern in the Residual Plot
Our previous findings are summarized in the plots below:
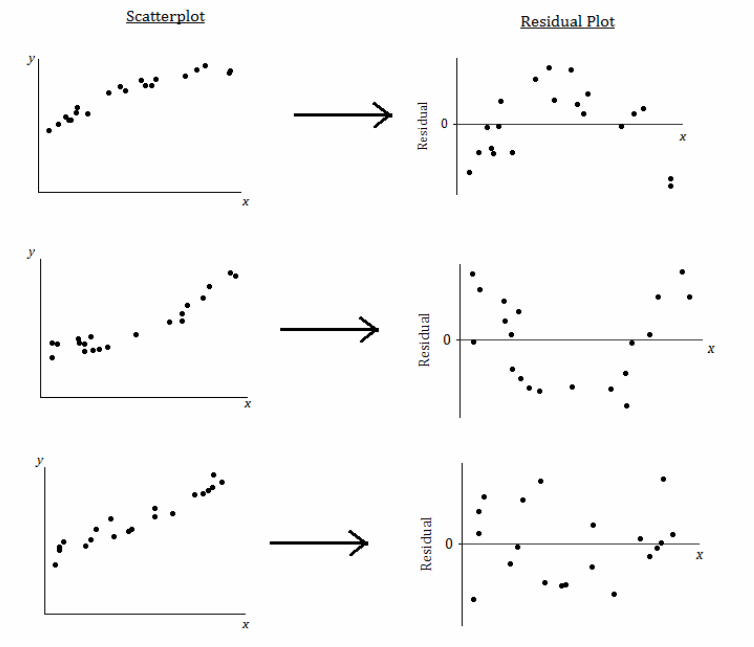
What does it mean when there is a curved pattern in the residual plot?
Answer:
Allow students to answer this question. Discuss with students that a curved pattern in the residual plot indicates that the relationship would be better described by a nonlinear function. When you see a curved pattern in the residual plot, you should investigate nonlinear models rather than using a line or model to describe the relationship. (See the first two scatter plots and residual plots in the figure above, which show a curved pattern in both the scatter plot and the residual plot.)
What does it mean when the points in the residual plot appear to be scattered at random with no visible pattern?
Answer:
Again, allow students to answer this question. Discuss with students that when the relationship is approximately linear, the points in the residual plot are scattered at random around the horizontal line at zero. This indicates that a linear model is an appropriate way to describe the relationship. (See the third scatter plot and residual plot in the figure above, which shows a linear pattern in the scatter plot and no pattern in the residual plot.)
Why not just look at the scatter plot of the original data set? Why was the residual plot necessary? The next example answers these questions.
Example 2.
Why Do You Need the Residual Plot?
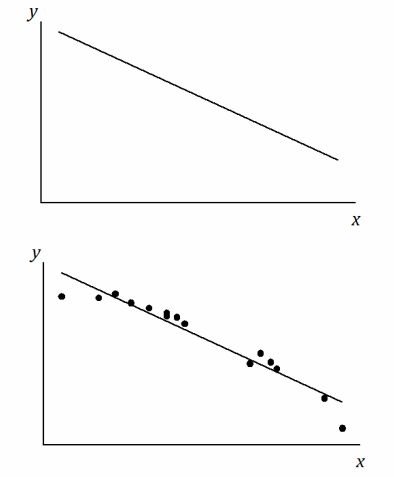
The temperature (in degrees Fahrenheit) was measured at various altitudes (in thousands of feet) above Los Angeles.
The scatter plot (below) seems to show a linear (straight-line) relationship between these two quantities.
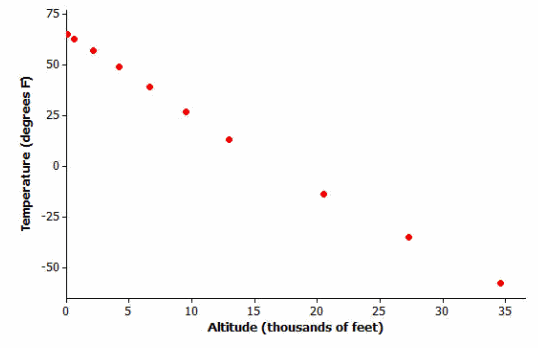
Data source: Core Math Tools, http://nctm.org
However, look at the residual plot:
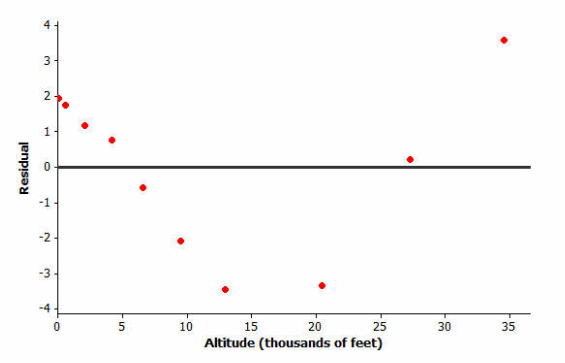
There is a clear curve in the residual plot. So what appeared to be a linear relationship in the original scatter plot was, in fact, a nonlinear relationship.
How did this residual plot result from the original scatter plot?
Answer:
The residuals are the vertical deviations from the least squares line in the original scatter plot. Because of the change of scale, tiny vertical deviations can be shown as much larger distances from the zero line in the residual plot. Therefore, a very subtle curvature in the original relationship can be seen more clearly in the residual plot. This is why you draw residual plots.
Eureka Math Algebra 1 Module 2 Lesson 18 Exercise Answer Key
Exercises 1–3: Volume and Temperature
Water expands as it heats. Researchers measured the volume (in milliliters) of water at various temperatures. The results are shown below.
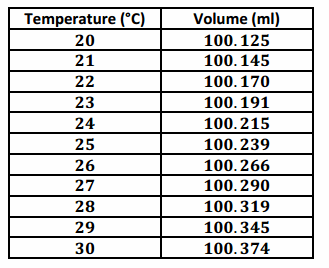
Exercise 1.
Using a graphing calculator, construct the scatter plot of this data set. Include the least squares line on your graph. Make a sketch of the scatter plot including the least squares line on the axes below.
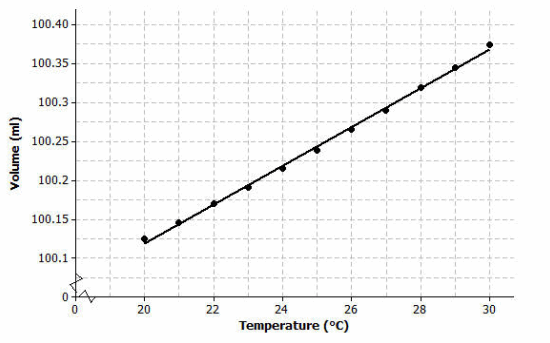
Although it might be clear from the scatter plot given here that there is a curved relationship between the two variables, this detail cannot, however, be seen in the low-resolution graph produced by a calculator.
Exercise 2.
Using the calculator, construct a residual plot for this data set. Make a sketch of the residual plot on the axes given below.
Exercise 3.
Do you see a clear curve in the residual plot? What does this say about the original data set?
Answer:
Yes, there is a clear curve in the residual plot. This indicates a nonlinear (curved) relationship between volume and temperature.
Eureka Math Algebra 1 Module 2 Lesson 18 Problem Set Answer Key
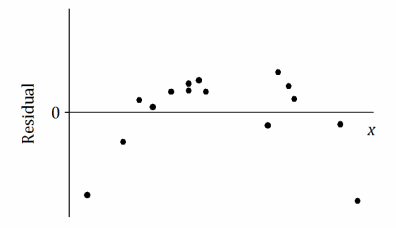
Question 1.
For each of the following residual plots, what conclusion would you reach about the relationship between the variables in the original data set? Indicate whether the values would be better represented by a linear or a nonlinear relationship.
a. 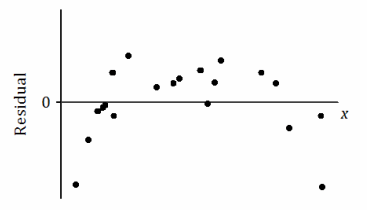
Answer:
There is a nonlinear relationship between the variables in the original data set.
b. 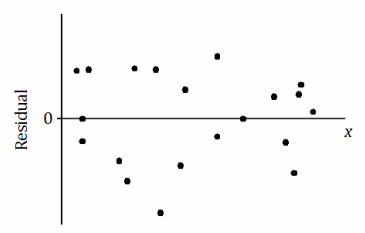
There is a linear relationship between the variables in the original data set.
c. 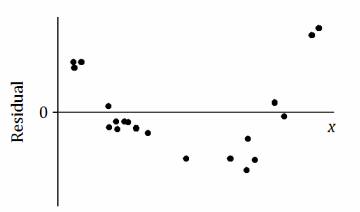
There is a nonlinear relationship between the variables in the original data set.
Question 2.
Suppose that after fitting a line, a data set produces the residual plot shown below.
An incomplete scatter plot of the original data set is shown below. The least squares line is shown, but the points in the scatter plot have been erased. Estimate the locations of the original points, and create an approximation of the scatter plot below.
Answer:
This problem should challenge students. There are many correct answers. Students should show points in the scatter plot whose vertical deviations from the given least squares line are in proportion to the values of the residuals in the residual plot. A student’s answer is only acceptable if it shows a general pattern like the one shown above. Confirm that each student’s points could result in (approximately) the given least squares line.
Eureka Math Algebra 1 Module 2 Lesson 18 Exit Ticket Answer Key
Question 1.
If you see a clear curve in the residual plot, what does this say about the original data set?
Answer:
A clear curve in the residual plot shows that the variables in the original data set have a nonlinear relationship.
Question 2.
If you see a random scatter of points in the residual plot, what does this say about the original data set?
Answer:
A random scatter of points in the residual plot shows that a straight line is an appropriate model for the relationship between the two variables in the original data set.