Engage NY Eureka Math Algebra 1 Module 2 Lesson 15 Answer Key
Eureka Math Algebra 1 Module 2 Lesson 15 Example Answer Key
Example 1.
Calculating Prediction Errors
The gestation time for an animal is the typical duration between conception and birth. The longevity of an animal is the typical lifespan for that animal. The gestation times (in days) and longevities (in years) for 13 types of animals are shown in the table below.
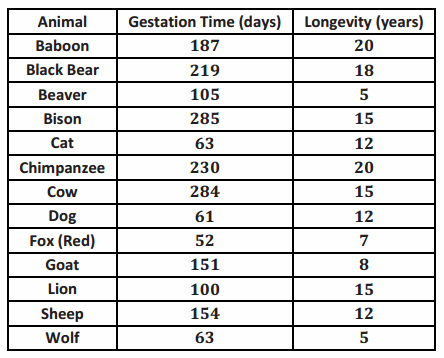
Data Source: Core Math Tools, http://nctm.org
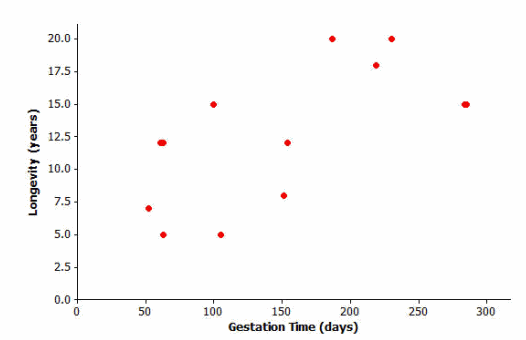
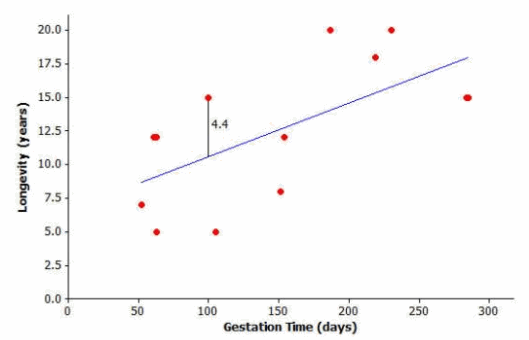
Here is the scatter plot for this data set:
Example 2.
Residuals as Prediction Errors
In previous exercises, you found out how much needs to be added to the predicted value to find the true value of an animal’s longevity. In order to find this, you have been calculating
actual value – predicted value.
This quantity is referred to as a residual. It is summarized as
residual = actual y-value – predicted y-value.
You can now work out the residuals for all of the points in our animal longevity example. The values of the residuals are shown in the table below.
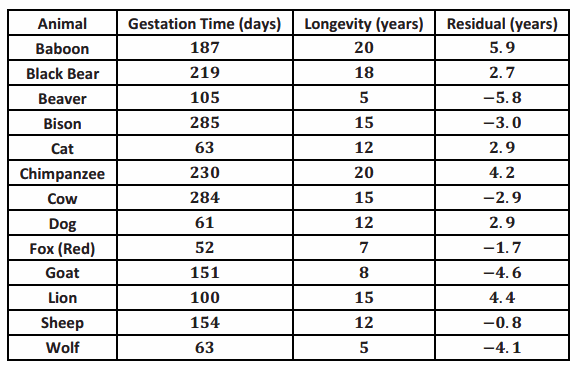
These residuals show that the actual longevity of an animal should be within six years of the longevity predicted by the least squares line.
Suppose you selected a type of animal that is not included in the original data set, and the gestation time for this type of animal is 270 days. Substituting x=270 into the equation of the least squares line you get
y=6.642+0.03974(270)
= 17.4.
The predicted longevity of this animal is 17.4 years.
Eureka Math Algebra 1 Module 2 Lesson 15 Exercise Answer Key
Exercises 1–4
Finding the equation of the least squares line relating longevity to gestation time for these types of animals provides the equation to predict longevity. How good is the line? In other words, if you were given the gestation time for another type of animal not included in the original list, how accurate would the least squares line be at predicting the longevity of that type of animal?
Exercise 1.
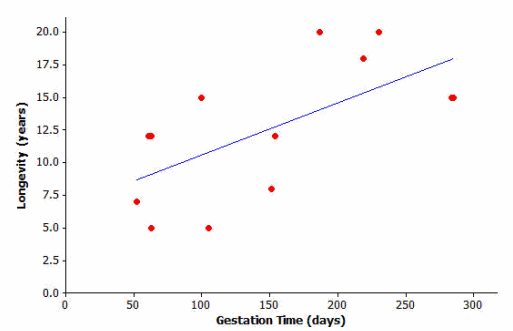
Using a graphing calculator, verify that the equation of the least squares line is y=6.642+0.03974x, where
x represents the gestation time (in days), and y represents longevity (in years).
The least squares line has been added to the scatter plot below.
Let students work independently on Exercises 2–4. Then discuss and confirm as a class.
Exercise 2.
Suppose a particular type of animal has a gestation time of 200 days. Approximately what value does the line predict for the longevity of that type of animal?
Answer:
y=6.642+0.03974(200)=14.59≈14.6
Exercise 3.
Would the value you predicted in Exercise 2 necessarily be the exact value for the longevity of that type of animal? Could the actual longevity of that type of animal be longer than predicted? Could it be shorter?
Answer:
We do not expect the longevity to be exactly 14.6 years. The actual longevity for this type of animal might be longer or shorter than 14.6 years.
You can investigate further by looking at the types of animals included in the original data set. Take the lion, for example. Its gestation time is 100 days. You also know that its longevity is 15 years, but what does the least squares line predict for the lion’s longevity?
Substituting x=100 days into the equation, you get y=6.642+0.03974(100) or approximately 10.6. The least squares line predicts the lion’s longevity to be approximately 10.6 years.
Exercise 4.
How close is this to being correct? More precisely, how much do you have to add to 10.6 to get the lion’s true longevity of 15?
Answer:
We predicted 10.6 years for the longevity of the lion, and students are asked what needs to be added to this value in order to get the lion’s actual longevity of 15 years. Students can do this calculation mentally by adding amounts to 10.6 until they get 15. It is important, then, to see the connection between this adding calculation and the subtraction 15-10.6. The result of this calculation, 4.4, is a residual.
You can show the prediction error of 4.4 years on the graph like this:
Exercises 5–6
Let’s continue to think about the gestation times and longevities of animals. Let’s specifically investigate how accurately the least squares line predicted the longevity of the black bear.
a. What is the gestation time for the black bear?
Answer:
219 days
b. Look at the graph. Roughly what does the least squares line predict for the longevity of the black bear?
Answer:
Around 15 years
c. Use the gestation time from part (a) and the least squares line y=6.642+0.03974x to predict the black bear’s longevity. Round your answer to the nearest tenth.
Answer:
15.3 years
d. What is the actual longevity of the black bear?
Answer:
18 years
e. How much do you have to add to the predicted value to get the actual longevity of the black bear?
Answer:
2.7 years
f. Show your answer to part (e) on the graph as a vertical line segment.
Answer:
Students should show a vertical line segment of length 2.7 from the least squares line to the point representing the black bear.
Exercise 6.
Repeat this activity for the sheep.
a. Substitute the sheep’s gestation time for x into the equation to find the predicted value for the sheep’s longevity. Round your answer to the nearest tenth.
Answer:
y=6.642+0.03974(154)=12.8
The predicted longevity for a sheep is 12.8 years.
b. What do you have to add to the predicted value in order to get the actual value of the sheep’s longevity? (Hint: Your answer should be negative.)
Answer:
12-12.8=-0.8
-0.8 years would need to be added to the predicted value in order to get the actual value.
c. Show your answer to part (b) on the graph as a vertical line segment. Write a sentence describing points in the graph for which a negative number would need to be added to the predicted value in order to get the actual value.
Answer:
Students should show a vertical line segment of length 0.8 from the least squares line to the point representing the sheep. For points that fall below the least squares line, you would need to add a negative number to the predicted value in order to get the actual value.
Exercises 7–8
Think about what the actual longevity of this type of animal might be.
Exercise 7.
Could it be 30 years? How about 5 years?
Answer:
It is unlikely that this type of animal would have a longevity as much as 30 years or as little as 5 years because these values are further from the predicted value (17.4 years) than the errors given by residuals in the table.
Exercise 8.
Judging by the size of the residuals in our table, what kind of values do you think would be reasonable for the longevity of this type of animal?
Answer:
A sensible range of possible values for the longevity is around 11–23 years.
Exercises 9–10
Continue to think about the gestation times and longevities of animals. The gestation time for the type of animal called the ocelot is known to be 85 days.
The least squares line predicts the longevity of the ocelot to be 10.0 years.
y=6.642+0.03974(85)=10.0
Exercise 9.
Based on the residuals in Example 3, would you be surprised to find that the longevity of the ocelot was 2 years? Why or why not? What might be a sensible range of values for the actual longevity of the ocelot?
Answer:
It is unlikely that the actual longevity of the ocelot is as little as 2 years; this would have a residual of 8 years, which is greater than the ones in the table. A sensible range of possible values might be from 4 years to 16 years.
Exercise 10.
We know that the actual longevity of the ocelot is 9 years. What is the residual for the ocelot?
Answer:
Residual =9-10=-1
The residual for the ocelot is -1 year.
Eureka Math Algebra 1 Module 2 Lesson 15 Problem Set Answer Key
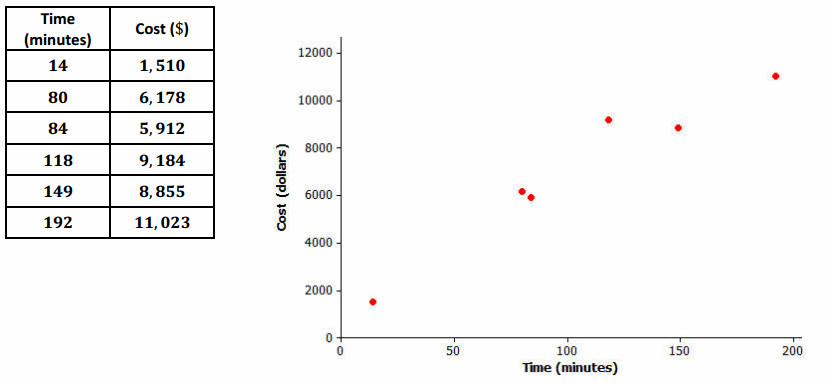
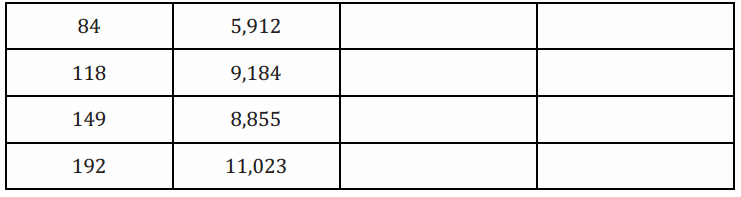
The time spent in surgery and the cost of surgery was recorded for six patients. The results and scatter plot are shown below.
Question 1.
Calculate the equation of the least squares line relating cost to time. (Indicate slope to the nearest tenth and y-intercept to the nearest whole number.)
Answer:
y=1514+52.7x, where x represents time and y represents cost
Question 2.
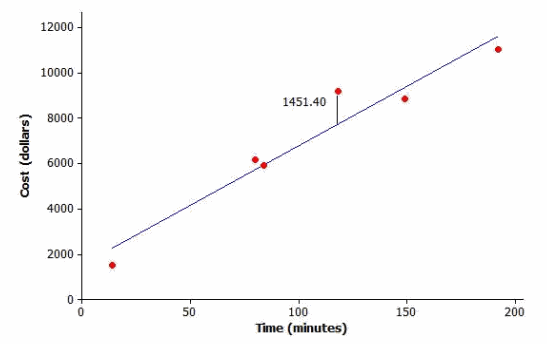
Draw the least squares line on the graph above. (Hint: Substitute x=30 into your equation to find the predicted y-value. Plot the point (30, your answer) on the graph. Then substitute x=180 into the equation, and plot the point. Join the two points with a straightedge.)
Answer:
Plot the points (30,3095) and (180,11000) on the graph.
Question 3.
What does the least squares line predict for the cost of a surgery that lasts 118 min.? (Calculate the cost to the nearest cent.)
Answer:
y=1514+52.7(118)=7732.60
The predicted cost for the surgery is $7,732.60.
Question 4.
How much do you have to add to your answer to Problem 3 to get the actual cost of surgery for a surgery lasting 118 min.? (This is the residual.)
Answer:
9184-7732.60=1451.40
$1,451.40 would need to be added.
Question 5.
Show your answer to Problem 4 as a vertical line between the point for that person in the scatter plot and the least squares line.
Answer:
(Shown on the graph above.)
Question 6.
Remember that the residual is the actual y-value minus the predicted y-value. Calculate the residual for the surgery that took 149 min. and cost $8,855.
Answer:
x=149; y=1514+52.7(149)=9366.30
Residual =8855-9366.3=-511.30
The residual is -511.30 dollars.
Question 7.
Calculate the other residuals, and write all the residuals in the table below.
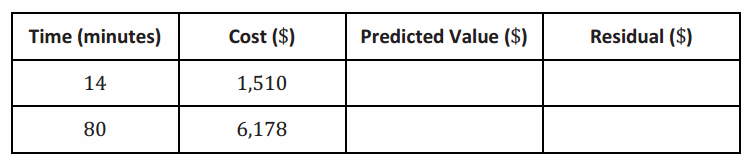
Answer:
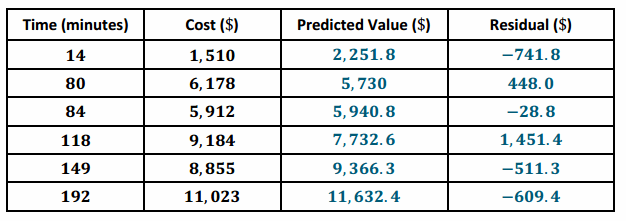
Question 8.
Suppose that a surgery took 100 min.
a. What does the least squares line predict for the cost of this surgery?
Answer:
x=100; y=1514+52.7(100)=6784
The predicted cost for the surgery is $6,784.
b. Would you be surprised if the actual cost of this surgery were $9,000? Why or why not?
Answer:
9000-6784=2216. This is much larger than any of the residuals in the table, so it would be surprising to find that the surgery was this expensive.
c. Interpret the slope of the least squares line.
Answer:
The slope is 52.7 dollars per minute. Interpret this slope in the following way: For each additional minute in surgery, the cost of the surgery increases by $52.70.
Eureka Math Algebra 1 Module 2 Lesson 15 Exit Ticket Answer Key
Meerkats have a gestation time of 70 days.
a. Use the equation of the least squares line from today’s class, y=6.643+0.03974x, to predict the longevity of the meerkat. Remember x equals the gestation time in days, and y equals the longevity in years.
Answer:
y=6.642+0.03974(70)=9.4
The predicted longevity of a meerkat is 9.4 years.
b. Approximately how close might your prediction be to the actual longevity of the meerkat? What was it (from class) that told you roughly how close a prediction might be to the true value?
Answer:
The prediction would be within about 6 years. We looked at the residuals for the original data set and saw that the largest residual was around 6 years.
c. According to your answers to parts (a) and (b), what is a reasonable range of possible values for the longevity of the meerkat?
Answer:
Between 3 and 15 years would be sensible.
d. The longevity of the meerkat is actually 10 years. Use this value and the predicted value that you calculated in part (a) to find the residual for the meerkat.
Answer:
Residual =10-9.4=0.6
The residual for the meerkat is 0.6 years.