Engage NY Eureka Math Algebra 1 Module 2 Lesson 10 Answer Key
Eureka Math Algebra 1 Module 2 Lesson 10 Exploratory Challenge Answer Key
Exploratory Challenge 1:
Extending the Frequency Table to a Relative Frequency Table
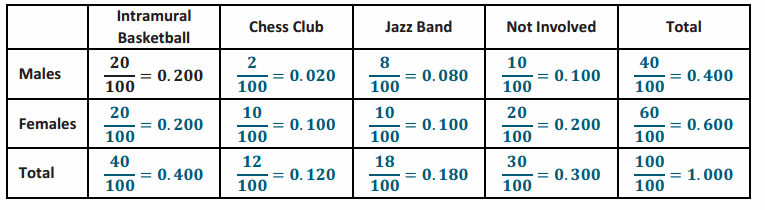
Determining the number of students in each cell presents the first step in organizing bivariate categorical data. Another way of analyzing the data in the table is to calculate the relative frequency for each cell. Relative frequencies relate each frequency count to the total number of observations. For each cell in this table, the relative frequency of a cell is found by dividing the frequency of that cell by the total number of responses.
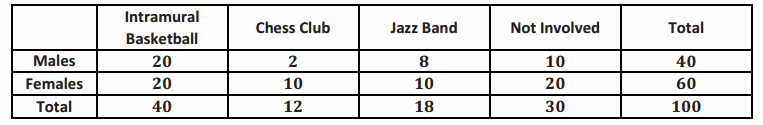
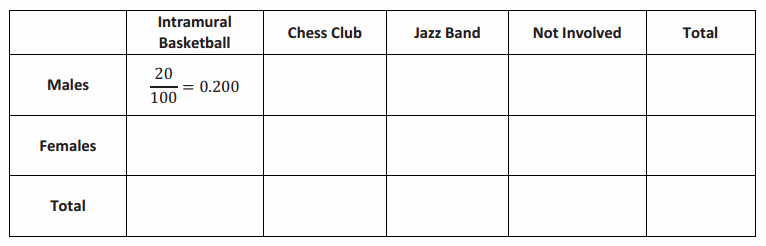
Consider the two-way frequency table from the previous lesson.
Two-way Frequency Table:
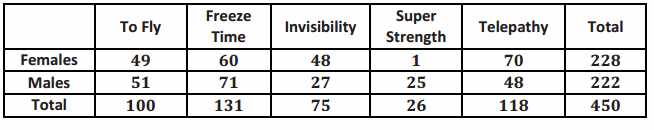
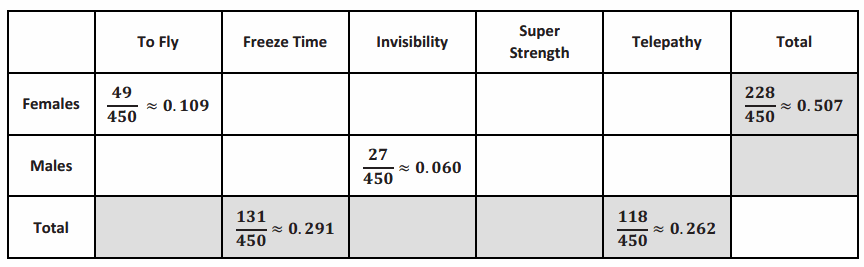
The relative frequency table would be found by dividing each of the above cell values by 450. For example, the relative frequency of females selecting to fly is \(\frac{49}{450}\), or approximately 0.109, to the nearest thousandth. A few of the other relative frequencies to the nearest thousandth are shown in the following relative frequency table:
Read through the Exploratory Challenge as a class.
Ask students to look at the relative frequency 49 out of 450 students, which is the first cell highlighted in the two-way frequency table. This cell represents females selecting the superpower to fly. Indicate to students that the relative frequency of this cell is a fraction, a decimal, or a percentage. The highlighted cell expresses the frequency as 0.109, to the nearest thousandth. The value could also be interpreted as approximately 10.9%, or about 11% of the students surveyed were females whose favorite superpower is the ability to fly. Work with students on the other examples of relative frequencies that appear in the two-way table. Point out that approximately 0.06, or 6% of the students surveyed were males whose favorite superpower is invisibility. Indicate that 131 of the 450 students, or 0.291, approximately 29%, selected freeze time as their favorite superpower. Then, discuss the following:
→ A relative frequency is found by dividing the frequency count by the total number of observations.
→ A relative frequency can be expressed as a decimal or a percentage or a fraction.
→ Explore the following question: How would the relative frequencies look if males and females had the same opinions about their favorite superpowers? This question is a prelude to Lesson 11. Use the question to indicate that because the number of females and the number of males are not the same, relative frequencies are difficult to interpret to answer this question. Some students may begin to indicate that a comparison to the total number of males or to the total number of females is more appropriate. This observation is addressed in the next lesson.
Exploratory Challenge 2:
Interpreting Data
Interest in superheroes continues at Rufus King High School. The students who analyzed the data in the previous lesson decided to create a comic strip for the school website that involves a superhero. They thought the summaries developed from the data would be helpful in designing the comic strip.
Only one power will be given to the superhero. A debate arose as to what power the school’s superhero would possess. Students used the two-way frequency table and the relative frequency table to continue the discussion. Take another look at those tables.
Scott initially indicated that the character created should have super strength as the special power. This suggestion was not well received by the other students planning this project. In particular, Jill argued, “Well, if you don’t want to ignore more than half of the readers, then I suggest telepathy is the better power for our character.”
Read through the Exploratory Challenge as a class.
Then, discuss the following:
→ Why would several students argue against Scott’s initial suggestion of choosing super strength?
→ 0.2% of the responses were females who preferred this power.
→ Why might Scott have made this suggestion?
→ Answers will vary. A reasonable answer could be personal preference.
→ Why would Jill say to use telepathy?
→ It has the largest frequency count for females.
→ Do you think there is a difference in the superpowers selected by males and those selected by females?
→ There are indications that males and females have differences in what superpowers they select. Less than 1% of the sample was females who selected to fly, while over 5% of the sample was males who selected to fly. The large difference suggests more males than females selected this superpower. However, point out to students that comparing the relative frequencies does not answer our question. Students may struggle to understand this question. (That is okay because the use of the relative frequency tables is limited.) Indicate that as we move into the next lesson, a direct comparison of these cells using conditional relative frequencies will provide a better indication of the gender differences in selection of superpowers.
Eureka Math Algebra 1 Module 2 Lesson 10 Exercise Answer Key
Exercises 1–7
Exercise 1.
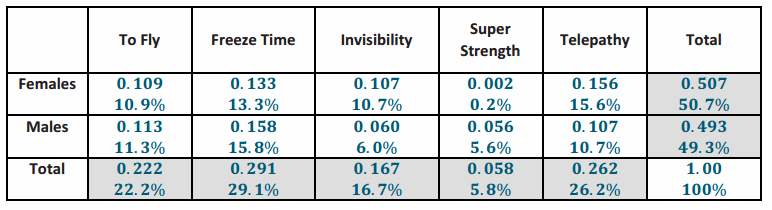
Calculate the remaining relative frequencies in the table below. Write the value in the table as a decimal rounded to the nearest thousandth or as a percent.
Two-Way Frequency Table:
Answer:
Exercise 2.
Based on previous work with frequency tables, which cells in this table would represent the joint relative frequencies?
Answer:
The joint relative frequency cells are represented by the unshaded cells within the body of the table.
Exercise 3.
Which cells in the relative frequency table would represent the marginal relative frequencies?
Answer:
The marginal relative frequency cells are represented by the shaded cells in the total row and total column.
Exercise 4.
What is the joint relative frequency for females who selected invisibility as their favorite superpower?
Answer:
The joint relative frequency for females who selected invisibility as their favorite superpower is 0.107, or approximately 10.7%. This indicates that approximately 11% of the students sampled were female who selected invisibility as their favorite superpower.
Exercise 5.
What is the marginal relative frequency for freeze time? Interpret the meaning of this value.
Answer:
29.1%, or approximately 29% of the total number of people surveyed, selected freeze time as their favorite superpower.
Exercise 6.
What is the difference in the joint relative frequencies for males and for females who selected to fly as their favorite superpower?
Answer:
The difference in the relative frequencies is 0.004, or 0.4%, or 0.113-0 .109.
Exercise 7.
Is there a noticeable difference between the genders and their favorite superpowers?
Answer:
Yes. The most noticeable differences are in the following superpowers: invisibility, super strength, and telepathy.
Exercises 8–10
Scott acknowledged that super strength was probably not the best choice based on the data. “The data indicate that freeze time is the most popular power for a superhero,” continued Scott. Jill, however, still did not agree with Scott that this was a good choice. She argued that telepathy was a better choice.
Exercise 8.
How do the data support Scott’s claim? Why do you think he selected freeze time as the special power for the comic strip superhero?
Answer:
Freeze time was the most popular choice among male students and among all students surveyed.
Exercise 9.
How do the data support Jill’s claim? Why do you think she selected telepathy as the special power for the comic strip superhero?
Answer:
Jill’s claim was based on the observation that telepathy was the most popular choice of female students.
Exercise 10.
Of the two special powers freeze time and telepathy, select one and justify why you think it is a better choice based on the data.
Answer:
Answers will vary. The two categories each represent 26% to 29% of the sample. More females selected telepathy, while more males selected freeze time.
Eureka Math Algebra 1 Module 2 Lesson 10 Problem Set Answer Key
Question 1.
Consider the Rufus King High School data from the previous lesson regarding after-school activities:
Calculate the relative frequencies for each of the cells to the nearest thousandth. Place the relative frequencies in the cells of the following table. (The first cell has been completed as an example.)
Answer:
Question 2.
Based on your relative frequency table, what is the relative frequency of students who indicated they play basketball?
Answer:
0.40, or 40%
Question 3.
Based on your table, what is the relative frequency of males who play basketball?
Answer:
0.20, or 20%
Question 4.
If a student were randomly selected from the students at the school, do you think the student selected would be a male or a female?
Answer:
The selection could be a female because 0.60, or 60%, of the students in the sample were females.
Question 5.
If a student were selected at random from school, do you think this student would be involved in an after-school program? Explain your answer.
Answer:
Yes, 70% of the students participate in an after-school program.
Question 6.
Why might someone question whether or not the students who completed the survey were randomly selected? If the students completing the survey were randomly selected, what do the marginal relative frequencies possibly tell you about the school? Explain your answer.
Answer:
A person may question the sample based on the assumption that you would anticipate 50% of the students would be female and 50% would be male. The marginal relative frequencies indicate that the sample was 60% female and 40% male. Possibly, the school has more females than males.
Question 7.
Why might females think they are more involved in after-school activities than males? Explain your answer.
Answer:
More females were involved in the after-school activities. 40 females were involved in the after-school activities, while 30 males were involved. (Note: Indicate to students that this will be explored in the next lesson.)
Eureka Math Algebra 1 Module 2 Lesson 10 Exit Ticket Answer Key
Juniors and seniors were asked if they plan to attend college immediately after graduation, seek full-time employment, or choose some other option. A random sample of 100 students was selected from those who completed the survey. Scott started to calculate the relative frequencies to the nearest thousandth.
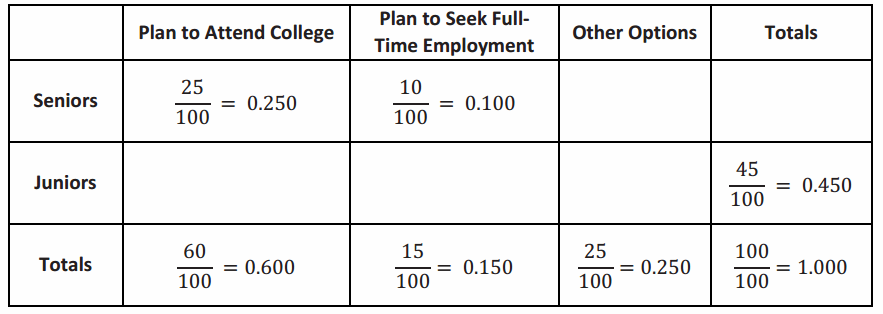
Question 1.
Complete the calculations of the relative frequencies for each of the blank cells. Round your answers to the nearest thousandth.
Answer:
The following is a completed chart:
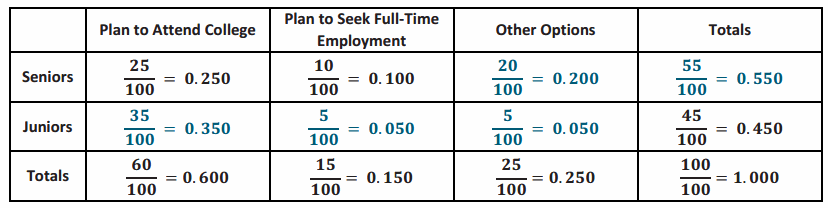
Question 2.
A school website article indicated that “A Vast Majority of Students from our School Plan to Attend College.” Do you agree or disagree with that article? Explain why you agree or disagree.
Answer:
Most of the students in the school plan to attend college after graduation (60% of sample). That is a clear majority. It is interesting, however, that a larger number of junior students plan to attend college, yet there were fewer juniors in the sample.
Question 3.
Do you think juniors and seniors differ regarding after-graduation options? Explain.
Answer:
There are some interesting differences. One difference is noted above concerning college. Another is the selection of other options. A very small percentage of the students selecting that option were juniors.