The solutions to Bridges in Mathematics Grade 3 Home Connections Answer Key Unit 2 Module 4 can help students to clear their doubts quickly.
Bridges in Mathematics Grade 3 Home Connections Answer Key Unit 2 Module 4
Bridges in Mathematics Grade 3 Home Connections Unit 2 Module 4 Session 1 Answer Key
Favorite Pets
Question 1.
Look at the two graphs below and then answer the following questions.

a. Do the picture graph and the bar graph above represent the same data?
Answer: Yes
b. Why or why not?
Answer: Each graph shows the same number of students for each pet.
c. Using the picture graph, tell how many students are in the class. Explain how you know.
Answer:
2 + 6 + 10 + 2 = 20
d. Using the bar graph, tell how many students are in the class. Explain how you know.
Answer: 20 students
Question 2.
CHALLENGE Mr. Neon’s class took a survey to find out everyone’s favorite fruit. The number of votes for each fruit is listed below. On a separate sheet of paper, draw a picture graph that shows the information. Be sure your graph has a title and labels
Bananas: 3 Apples: 7 Grapes: 6 Watermelon: 4 Strawberries: 4
Answer:
Review
Question 3.
Conrad says that 8 × 7 is the same as 8 × 5 plus 8 × 2. Do you agree or disagree? Explain your thinking.
Answer:
Conrad says that 8 × 7 is the same as 8 × 5 plus 8 × 2.
8 × 7 = 56
8 × 5 = 40
8 × 2 = 16
40 + 16 = 56
Conard is correct.
Question 4.
Alexis says that 6 × 9 is the same as 6 × 9 plus 6 × 9. Do you agree or disagree? Explain your thinking.
Answer:
Alexis says that 6 × 9 is the same as 6 × 9 plus 6 × 9.
6 × 9 = 54
54 + 54 = 108
Alexis is incorrect.
Question 5.
CHALLENGE Melea needs to provide 200 pieces of fruit for the local elementary school. Melea has 15 baskets. Each basket has 9 pieces of fruit in it. Does Melea have enough fruit? Show your thinking with numbers, pictures, or words.

Answer:
Given,
Melea needs to provide 200 pieces of fruit for the local elementary school.
Melea has 15 baskets. Each basket has 9 pieces of fruit in it.
9 × 15 = 135
132 < 200
Bridges in Mathematics Grade 3 Home Connections Unit 2 Module 4 Session 3 Answer Key
The Pencil Survey
One day last spring, Ms. Brown asked her third graders to clean out their desks. She couldn’t believe how many pencils most of the kids pulled out. “So that’s where all the pencils have been!” she thought.
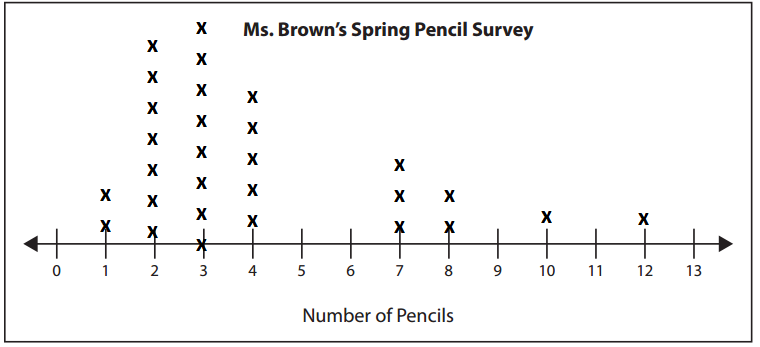
Ms. Brown decided to take a survey to find out how many pencils had been hiding in the kids’ desks. The table below shows the survey results.

Question 1.
a. Record the data on the line plot below.

Answer:

b. What was the most common number of pencils for a student to have in their desk in the spring?
Answer:
From the above line plot we can say the most common number of pencils for a student to have in their desk in the spring are 3 pencils.
Question 2.
a. The next year, Ms. Brown thought, “I will ask the students to clean out their desks earlier this year so we don’t run out of pencils so fast.” The line plot below shows how many pencils the kids found in their desks that time.

b. What was the most common number of pencils for a student to have in their desk in the fall?
Answer: 1 pencil
Question 3.
Were there more pencils hiding in the students’ desks last spring (see problem 1) or in the fall (see problem 2) ? Explain how you figured it out.
Answer: There were more pencils in the spring.
Question 4.
CHALLENGE Exactly how many pencils were hiding in students’ desks when Ms. Brown did the fall survey? (Hint: Be careful! The answer is not 24 pencils.)
Answer: 51 pencils