Redefine your true self by practicing from the Big Ideas Math Algebra 2 Answer Key Ch 11 Data Analysis and Statistics. Shed the Societal Narratives holding you back and let the Big Ideas Math Algebra 2 Chapter 11 Data Analysis and Statistics bridge the Success. Seek the homework help you might need as a part of the preparation and score better grades in exams taking the help of the Big Ideas Math Algebra 2 Answers Chapter 11 Data Analysis and Statistics.
The Big Ideas Math Book Algebra 2 Answer Key Ch 11 Data Analysis and Statistics includes questions belonging to Exercises, Chapter Tests, Review Tests, Cumulative Assessments, Practice Tests, etc. Step by Step Solutions provided for all the Big Ideas Math Algebra 2 Chapter 11 Data Analysis and Statistics Questions ensures you understand the concepts easily.
Big Ideas Math Book Algebra 2 Answer Key Chapter 11 Data Analysis and Statistics
Below is the list of Topicwise Big Ideas Math Textbook Algebra 2 Chapter 11 Data Analysis and Statistics Answers. All of them are sequenced as per the BIM Textbooks and are as per the latest Common Core Curriculum. All you have to do is simply tap on the quick links available to learn the respective topics. Have an indepth understanding of concepts from easy to complex ones by solving the Big Ideas Math Answer Key Ch 11 Data Analysis and Statistics on a regular basis.
- Data Analysis and Statistics Maintaining Mathematical Proficiency – Page 593
- Data Analysis and Statistics Mathematical Practices – Page 594
- Lesson 11.1 Using Normal Distributions – Page(597-602)
- Using Normal Distributions 11.1 Exercises – Page(600 – 602)
- Lesson 11.2 Populations, Samples, and Hypotheses – Page(603 – 608)
- Populations, Samples, and Hypotheses 11.2 Exercises – Page(607 – 608)
- Lesson 11.3 Collecting Data – Page(609 – 616)
- Collecting Data 11.3 Exercises – Page(614 – 616)
- Data Analysis and Statistics Study Skills: Reworking Your Notes – Page 617
- Data Analysis and Statistics 11.1–11.3 Quiz – Page 618
- Lesson 11.4 Experimental Design – Page(619 – 624)
- Experimental Design 11.4 Exercises – Page(623 – 624)
- Lesson 11.5 Making Inferences from Sample Surveys – Page(625 – 632)
- Making Inferences from Sample Surveys 11.5 Exercises – Page(630 – 632)
- Lesson 11.6 Making Inferences from Experiments – Page(633 – 638)
- Making Inferences from Experiments 11.6 Exercises – Page(637 – 638)
- Data Analysis and Statistics Performance Task: Curving the Test – Page 639
- Data Analysis and Statistics Chapter Review – Page(640 – 642)
- Data Analysis and Statistics Chapter Test – Page 643
- Data Analysis and Statistics Cumulative Assessment – Page(644 – 646)
Data Analysis and Statistics Maintaining Mathematical Proficiency
Find the mean, median, and mode of the data set. Then determine which measure of center best represents the data. Explain.
Question 1.
36, 82, 94, 83, 86, 82
Answer:
Mean = 77.16
Median = 82.5
Mode = 82
Median best represents the data.
Explanation:
Mean = \(\frac { 36 + 82 + 94 + 83 + 86 + 82 }{ 6 } \)
= 77.16
Arrange the data
36, 82, 82, 83, 86, 94
Median = \(\frac { 82 + 83 }{ 2 } \)
= 82.5
Mode = 82
Question 2.
74, 89, 71, 70, 68, 70
Answer:
Mean = 73.6
Median = 70.5
Mode = 70
Median best represents the data.
Explanation:
Mean = \(\frac {74 + 89 + 71 + 70 + 68 + 70 }{ 6 } \)
= 73.6
Arrange the data
68, 70, 70, 71, 74, 89
Median = \(\frac { 70 + 71 }{ 2 } \)
= 70.5
Mode = 70
Question 3.
1, 18, 12, 16, 11, 15, 17, 44, 44
Answer:
Mean = 19.7
Median = 16
Mode = 44
Median best represents the data.
Explanation:
Mean = \(\frac { 1 + 18 + 12 + 16 + 11 + 15 + 17 + 44 + 44 }{ 9} \)
= 19.7
Arrange the data
1, 11, 12, 15, 16, 17, 18, 44, 44
Median = 16
Mode = 44
Find and interpret the standard deviation of the data set.
Question 4.
43, 48, 41, 51, 42
Answer:
Standard deviation = 3.84
Explanation:
Mean = \(\frac { 43 + 48 + 41 + 51 + 42 }{ 5} \)
= 45
| x | μ | (x – μ) | (x – μ)² |
|---|---|---|---|
| 43 | 45 | -2 | 4 |
| 48 | 45 | 3 | 9 |
| 41 | 45 | -4 | 16 |
| 51 | 45 | 6 | 36 |
| 42 | 45 | -3 | 9 |
Variance = \(\frac { 4 + 9 + 16 + 36 + 9 }{ 5 } \)
= 14.8
Standard deviation = √(14.8) = 3.84
Question 5.
28, 26, 21, 44, 29, 32
Answer:
Standard deviation = 7.09
Explanation:
Mean = \(\frac { 28 + 26 + 21 + 44 + 29 + 32 }{ 6} \)
= 30
| x | μ | (x – μ) | (x – μ)² |
|---|---|---|---|
| 28 | 30 | -2 | 4 |
| 26 | 30 | -4 | 16 |
| 21 | 30 | -9 | 81 |
| 44 | 30 | 14 | 196 |
| 29 | 30 | -1 | 1 |
| 32 | 30 | 2 | 4 |
Variance = \(\frac { 4 + 16 + 81 + 196 + 1 + 4 }{ 6 } \)
= 50.3
Standard deviation = √(50.3) = 7.09
Question 6.
65, 56, 49, 66, 62, 52, 53, 49
Answer:
Standard deviation = 6.5
Explanation:
Mean = \(\frac { 65+ 56+ 49+ 66+ 62+ 52+ 53+ 49 }{ 8} \)
= 56.5
| x | μ | (x – μ) | (x – μ)² |
|---|---|---|---|
| 65 | 56.5 | 8.5 | 72.25 |
| 56 | 56.5 | -0.5 | 0.25 |
| 49 | 56.5 | -7.5 | 56.25 |
| 66 | 56.5 | 9.5 | 90.25 |
| 62 | 56.5 | 5.5 | 30.25 |
| 52 | 56.5 | -4.5 | 20.25 |
| 53 | 56.5 | -3.5 | 12.25 |
| 49 | 56.5 | -7.5 | 56.25 |
Variance = \(\frac { 72.25 + 0.25 + 56.25 + 90.25 + 30.25 + 20.25 + 12.25 + 56.25 }{ 8 } \)
= 42.25
Standard deviation = √(42.25) = 6.5
Question 7.
ABSTRACT REASONING
Describe a data set that has a standard deviation of zero. Can a standard deviation be negative? Explain your reasoning.
Answer: A dataset having a standard deviation of zero would indicate that every data value would be equal to the mean.
Standard Deviation cannot be negative because as soon as we have at least two numbers in the data set which are not exactly equal to on another, the standard deviation has to be positive.
Data Analysis and Statistics Mathematical Practices
Mathematically proficient students use diagrams and graphs to show relationships between data. They also analyze data to draw conclusions.
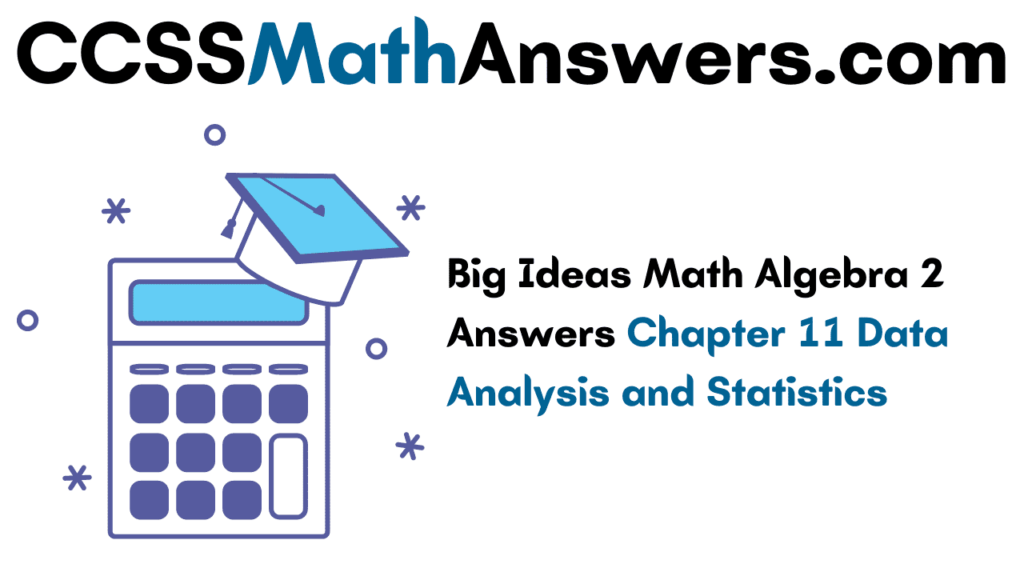
Monitoring Progress
Use the Internet or some other reference to determine which age pyramid is that of Canada, Japan, and Mexico. Compare the mean, median, and mode of the three age pyramids.
Question 1.
Answer:
For Male,
Mean = 30.65347
Median class = 24.5 – 29.5 = 27.57
Modal class = 4.5 – 9.5
Mode = 8.3274
For Female,
Mean = 32.2377
Median class = 29.5 – 34.5
Median = 29.7866
Modal class = 14.5-19.5
Mode = 16.7714
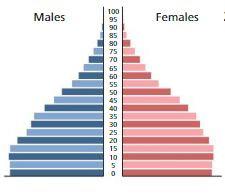
Question 2.
Answer:
Given, Pyramid
a. The mean is less than that of Japan’s but higher than Mexico’s
b. Median = 14.8
c. Mode = 45 years
Question 3.

Answer:
Lesson 11.1 Using Normal Distributions
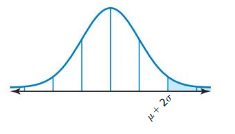
Essential Question In a normal distribution, about what percent of the data lies within one, two, and three standard deviations of the mean?
Recall that the standard deviation σ of a numerical data set is given by
σ = \(\sqrt{\frac{\left(x_{1}-\mu\right)^{2}+\left(x_{2}-\mu\right)^{2}+\cdots+\left(x_{n}-\mu\right)^{2}}{n}}\)
where n is the number of values in the data set and μ is the mean of the data set.
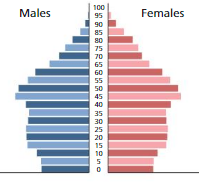
EXPLORATION 1
Analyzing a Normal Distribution
Work with a partner. In many naturally occurring data sets, the histogram of the data is bell-shaped. In statistics, such data sets are said to have a normal distribution. For the normal distribution shown below, estimate the percent of the data that lies within one, two, and three standard deviations of the mean. Each square on the grid represents 1%.
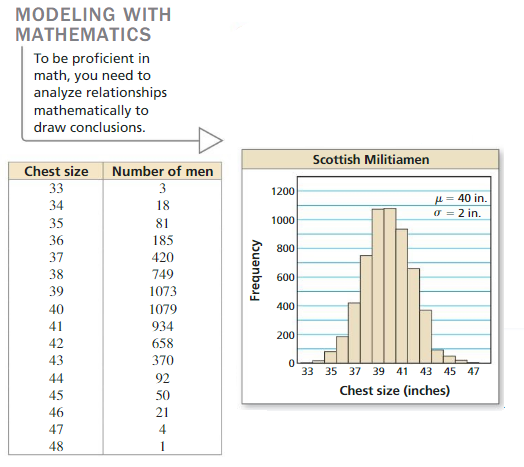
EXPLORATION 2
Analyzing a Data Set
Work with a partner. A famous data set was collected in Scotland in the mid-1800s. It contains the chest sizes (in inches) of 5738 men in the Scottish Militia. Do the data fit a normal distribution? Explain.
Communicate Your Answer
Question 3.
In a normal distribution, about what percent of the data lies within one, two, and three standard deviations of the mean?
Answer:
The 68% of the normal distribution lies within one standard deviation of the mean.
The 95% of the normal distribution lies within two standard deviation of the mean.
The 99.7% of the normal distribution lies within three standard deviation of the mean.
Question 4.
Use the Internet or some other reference to find another data set that is normally distributed. Display your data in a histogram.
Answer:
A normal distribution has mean μ and standard deviation σ. Find the indicated probability for a randomly selected x-value from the distribution.
Question 1.
P(x ≤ μ)
Answer:
P(x ≤ μ)= 0.5
Explanation:
Because of the symmetry of the normal curve, half of the values are on each side of the mean μ.
so, P(x ≤ μ)= 0.5
Question 2.
P(x ≥ μ)
Answer:
P(x ≥ μ) = 0.5
Explanation:
Because of the symmetry of the normal curve, half of the values are on each side of the mean μ.
P(x ≥ μ) = 0.5
Question 3.
P(μ ≤ x ≤ μ + 2σ)
Answer:
P(μ ≤ x ≤ μ + 2σ) = 0.475
Explanation:
The probability that a randomly selected x-value lies between μ and μ + 2σ is the marked area under the normal curve.
P(μ ≤ x ≤ μ + 2σ) = 0.34 + 0.135 = 0.475
Question 4.
P(μ − σ ≤ x ≤ μ)
Answer:
P(μ − σ ≤ x ≤ μ) = 0.34
Explanation:
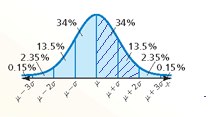
The total area under the related normal curve is 1
About 68% of the area lies within μ ± σ
About 95% of the area lies within μ ± 2σ
About 99.7% of the area lies within μ ± 3σ
compute the area under the curve bounded from the left with μ − σ and from the right with μ. thus, using the properties of distribution
P(μ − σ ≤ x ≤ μ) = \(\frac { 0.68 }{ 2 } \)
= 0.34
Question 5.
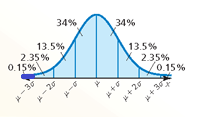
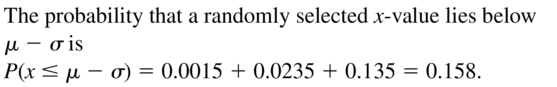
P(x ≤ μ − 3σ)
Answer:
P(x ≤ μ − 3σ) = 0.0015
Explanation:
The probability that randomly selected x-value lies between μ and μ + 2σ is the marked area under the normal curve
P(x ≤ μ − 3σ) = 0.0015
Question 6.
P(x ≥ μ + σ)
Answer:
P(x ≥ μ + σ) = 0.16
Explanation:
The probability that randomly selected x-value lies between μ – σ and μ is the marked area under the normal curve
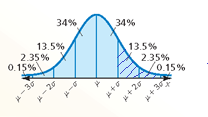
P(x ≥ μ + σ) = 0.135 + 0.0235 + 0.0015 = 0.16
Question 7.
WHAT IF?
In Example 2, about what percent of the people taking the test have scores between 43 and 79?
Answer:
P(43 ≤ x ≤ 79) = 0.815
Explanation:
Lets suppose that a normal distribution has a mean μ = 55 and standard deviation σ = 12. Compute
P(43 ≤ x ≤ 79)
consider the following
μ – 43 = 55 – 43 = 12 = σ
25 = μ – σ
79 – μ = 79 – 55 = 24 = 2 . 12 = 2σ
7 = μ + 2σ
P(43 ≤ x ≤ 79) = P(μ – σ ≤ x ≤ μ + 2σ)
= P(μ – σ ≤ x ≤ μ) + P(μ ≤ x ≤ μ + 2σ)
= \(\frac { .68 }{ 2 } \) + \(\frac { 0.95 }{ 2 } \)
= 0.34 + 0.475
= 0.815
Question 8.
WHAT IF?
In Example 3, what is the probability that the infant weighs 3990 grams or more?
Answer:
The probability that the infant weighs 3990 grams or more is 0.1151
Explanation:
Lets suppose that a normal distribution has a mean μ = 3270 and standard deviation σ = 600. Compute
P(x ≥ 3990)
z = \(\frac { x – μ }{ σ } \)
The z value for a particular x-value is called the z score for the x-value and is the number of standard deviations the x-value lies above or below the mean μ. The z-scores will be read directly from the table.
P(x ≥ 3990) = P(\(\frac { x – 3270 }{ 600 } \) ≥\(\frac { 3990 – 3270 }{ 600 } \)) = P(z ≥ 1.2) = 1 – P(z<1.2)
P(z<1.2) = 0.8849
P(x ≥ 3990) = 1 – 0.8849 = 0.1151
The probability that the infant weighs 3990 grams or more is 0.1151
Question 9.
Explain why it makes sense that P(z ≤ 0) = 0.5.
Answer:
We know that the area under the curve of the normal distribution is 1. Thus, there are left of the mean will be half of it i.e 0.5. Compute this probability by using the z-values
z = \(\frac { x – μ }{ σ } \)
The z value for a particular x-value is called the z score for the x-value and is the number of standard deviations the x-value lies above or below the mean μ. The z-scores will be read directly from the table.
P(x≤μ) = P(\(\frac { x – μ }{ σ } \)<\(\frac { μ – μ }{ σ } \)) = P(z≤0)
P(x≤μ) = P(z≤0)
Since P(x≤μ) = 0.5
P(z≤0) = 0.5
Question 10.
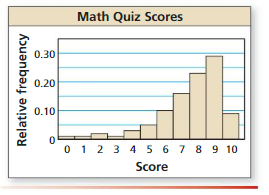
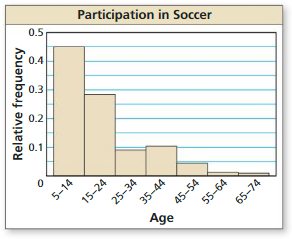
Determine whether the histogram has a normal distribution.
Answer:
The histogram doesn’t have a normal distribution.
Explanation:
The histogram is skewed left. So, the histogram does not have a normal distribution and you cannot use the normal distribution to interpret the histogram.
Using Normal Distributions 11.1 Exercises
Vocabulary and Core Concept Check
Question 1.
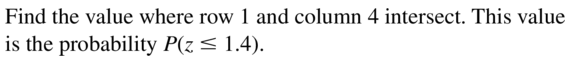
WRITING
Describe how to use the standard normal table to find P(z ≤ 1.4).
Answer:
Question 2.
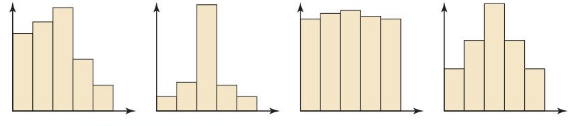
WHICH ONE DOESN’T BELONG?
Which histogram does not belong with the other three? Explain your reasoning.
Answer:
The first diagram doesn’t belong to the remaining. It is because the remaining diagrams are symmetric in the bell-shaped curve and the first diagram is not.
Monitoring Progress and Modeling with Mathematics
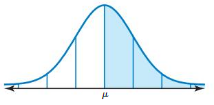
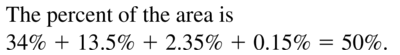
ATTENDING TO PRECISION In Exercises 3–6, give the percent of the area under the normal curve represented by the shaded region(s).
Question 3.
Answer:
Question 4.
Answer:
The area under the curve is 15.85%
Explanation:
The total area under the related normal curve is 1
About 68% of the area lies within μ ± σ
About 95% of the area lies within μ ± 2σ
About 99.7% of the area lies within μ ± 3σ
compute the area under the curve bounded from the left with μ − σ and from the right with μ. thus, using the properties of the distribution
\(\frac { (μ – 3σ) – (μ – σ) }{ 2 } \) = \(\frac { 99.7 – 68 }{ 2 } \) = 15.85%
Question 5.
Answer:
![]()
Question 6.
Answer:
The area under the curve is 27%
Explanation:
The total area under the related normal curve is 1
About 68% of the area lies within μ ± σ
About 95% of the area lies within μ ± 2σ
About 99.7% of the area lies within μ ± 3σ
compute the area under the curve bounded from the left with μ − σ and from the right with μ. thus, using the properties of the distribution
(μ – 2σ) – (μ – σ) = 95 – 68 = 27%
In Exercises 7–12, a normal distribution has mean μ and standard deviation σ. Find the indicated probability for a randomly selected x-value from the distribution.
Question 7.
P(x ≤ μ − σ)
Answer:
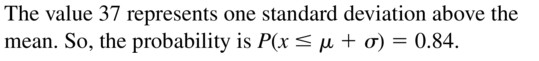
Question 8.
P(x ≥ μ − σ)
Answer:
P(x ≥ μ − σ) = 0.84
Explanation:
The total area under the related normal curve is 1
About 68% of the area lies within μ ± σ
About 95% of the area lies within μ ± 2σ
About 99.7% of the area lies within μ ± 3σ
P(x ≥ μ − σ) = 1 – P(x < μ − σ)
= 1 – P(x ≤ μ − σ)
= 1 – 0.16
= 0.84
Question 9.
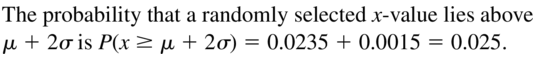
P(x ≥ μ + 2σ)
Answer:
Question 10.
P(x ≤ μ + σ)
Answer:
P(x ≤ μ + σ) = 0.84
Explanation:
The total area under the related normal curve is 1
About 68% of the area lies within μ ± σ
About 95% of the area lies within μ ± 2σ
About 99.7% of the area lies within μ ± 3σ
\(\frac { 1 + μ + σ }{ 2 } \) = \(\frac { 1 + 0.68 }{ 2 } \) = 0.84
P(x ≤ μ + σ) = 0.84
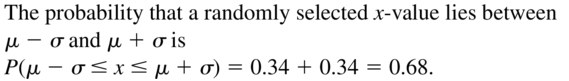
Question 11.
P(μ − σ ≤ x ≤ μ + σ)
Answer:
Question 12.
P(μ − 3σ ≤ x ≤ μ)
Answer:
P(μ − 3σ ≤ x ≤ μ) = 0.4985
Explanation:
The total area under the related normal curve is 1
About 68% of the area lies within μ ± σ
About 95% of the area lies within μ ± 2σ
About 99.7% of the area lies within μ ± 3σ
P(μ − 3σ ≤ x ≤ μ) = \(\frac { 0.997 }{ 2 } \)
= 0.4985
In Exercises 13–18, a normal distribution has a mean of 33 and a standard deviation of 4. Find the probability that a randomly selected x-value from the distribution is in the given interval.
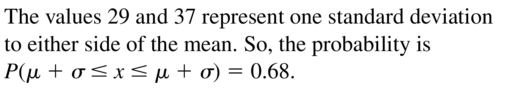
Question 13.
between 29 and 37
Answer:
Question 14.
between 33 and 45
Answer:
P(33 ≤ x ≤ 45) = 0.4985
Explanation:
Lets suppose that a normal distribution has a mean μ = 33 and standard deviation σ = 4. Compute
P(33 ≤ x ≤ 45)
μ – 33 = 33 – 33 = 0
So, 33 = μ
45 – μ = 45 – 33 = 12 = 3 . 4 = 3σ
So, 45 = μ + 3σ
P(33 ≤ x ≤ 45) = P(3μ ≤ x ≤ μ + 3σ) = \(\frac { 0.997 }{ 2 } \) = 0.4985
Question 15.
at least 25
Answer:
Question 16.
at least 29
Answer:
P(x ≥ 29) = 0.84
Explanation:
Lets suppose that a normal distribution has a mean μ = 33 and standard deviation σ = 4. Compute
P(x ≥ 29)
μ – 29 = 33 – 29 = 4 = σ
So, 29 = μ – σ
P(x ≥ 29) = P(x ≥ μ – σ) = 0.5 + \(\frac { 0.68 }{ 2 } \) = 0.5 + 0.34
= 0.84
Question 17.
at most 37
Answer:
Question 18.
at most 21
Answer:
P(x ≤ 21) = 0.0015
Explanation:
Lets suppose that a normal distribution has a mean μ = 33 and standard deviation σ = 4. Compute
P(x ≤ 21)
μ – 21 = 33 – 21 = 12 = 3 . 4 = 3σ
So, 21 = μ + 3σ
P(x ≤ 21) = P(x ≤ μ – 3σ) = \(\frac { 1 – 0.997 }{ 2 } \) = 0.0015
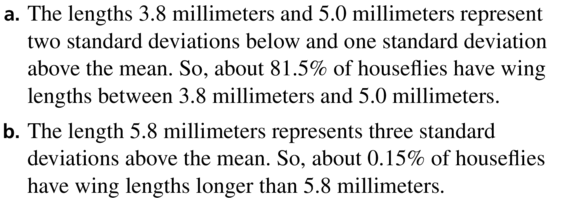
Question 19.
PROBLEM SOLVING
The wing lengths of houseflies are normally distributed with a mean of 4.6 millimeters and a standard deviation of 0.4 millimeter.
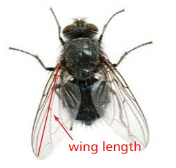
a. About what percent of houseflies have wing lengths between 3.8 millimeters and 5.0 millimeters?
b. About what percent of houseflies have wing lengths longer than 5.8 millimeters?
Answer:
Question 20.
PROBLEM SOLVING
The times a fire department takes to arrive at the scene of an emergency are normally distributed with a mean of 6 minutes and a standard deviation of 1 minute.
a. For about what percent of emergencies does the fire department arrive at the scene in 8 minutes or less?
b. The goal of the fire department is to reach the scene of an emergency in 5 minutes or less. About what percent of the time does the fire department achieve its goal?
Answer:
a. About 97.5% fire department arrives at the scene in 8 minutes or less
b. About 16% fire department reaches the goal.
Explanation:
a. The time of a fire department takes to arrive at the scene of an emergency are normally distributed with mean of 6 minutes, σ = 1 min. Compute what percent of emergencies does the fire department arrive at the scene in 8 minutes or less
P(x≤8)
8 – μ = 8 – 6 = 2 = 2 . 1 = 2σ
So, 8 = μ + 2σ
P(x≤8) = P(x≤μ + 2σ) = 0.5 + \(\frac { 0.95 }{ 2 } \)
= 0.5 + 0.475 = 0.975
About 97.5% fire department arrives at the scene in 8 minutes or less
b. Compute what percent of the time does the fire department achieve its goal
P((x≤5)
μ – 5 = 6 – 5 = 1 = σ
So, 5 = μ – σ
P((x≤5) = P((x≤μ – σ) = \(\frac {1 – 0.68 }{ 2 } \)
= 0.16
About 16% fire department reaches the goal.
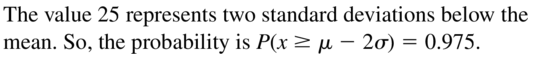
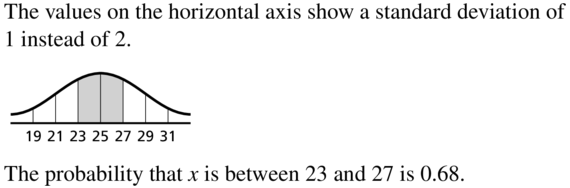
ERROR ANALYSIS In Exercises 21 and 22, a normal distribution has a mean of 25 and a standard deviation of 2. Describe and correct the error in finding the probability that a randomly selected x-value is in the given interval.
Question 21.
between 23 and 27
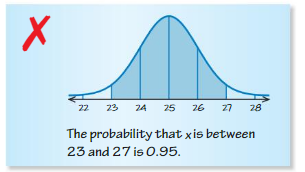
Answer:
Question 22.
at least 21
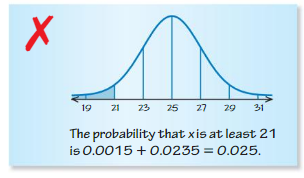
Answer:
P(x ≥21) = P(x ≥ μ − 2σ) = 0.475 + 0.5
= 0.975
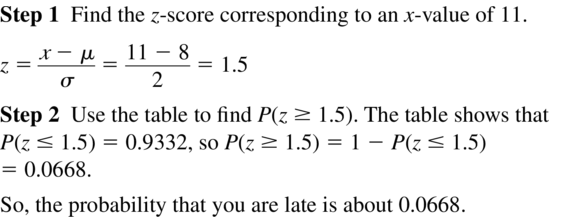
Question 23.
PROBLEM SOLVING
A busy time to visit a bank is during its Friday evening rush hours. For these hours, the waiting times at the drive-through window are normally distributed with a mean of 8 minutes and a standard deviation of 2 minutes. You have no more than 11 minutes to do your banking and still make it to your meeting on time. What is the probability that you will be late for the meeting?
Answer:
Question 24.
PROBLEM SOLVING
Scientists conducted aerial surveys of a seal sanctuary and recorded the number x of seals they observed during each survey. The numbers of seals observed were normally distributed with a mean of 73 seals and a standard deviation of 14.1 seals. Find the probability that at most 50 seals were observed during a randomly chosen survey.

Answer:
The probability that at most 50 seals were observed during a randomly chosen survey is 0.0548
Explanation:
The number of seals observed were normally distributed with μ = 73 seals, σ = 14.1 seal
z = \(\frac { x – μ }{ σ } \)
P(x≤50) = P(\(\frac { x – 73 }{ 14.1 } \)≤\(\frac { 50 – 73 }{ 14.1 } \)) = P(z≤-1.6)
P(x≤50) = P(z≤-1.6) = 0.0548
In Exercises 25 and 26, determine whether the histogram has a normal distribution.
Question 25.
Answer:
![]()
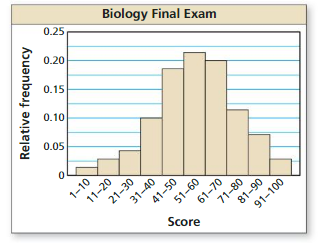
Question 26.
Answer:
The histogram is bell shaped and fairly symmetric. So, the histogram has an approximately normal distribution.
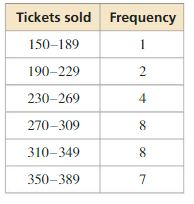
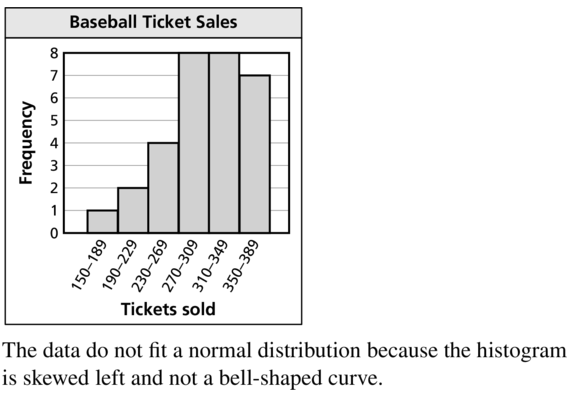
Question 27.
ANALYZING RELATIONSHIPS
The table shows the numbers of tickets that are sold for various baseball games in a league over an entire season. Display the data in a histogram. Do the data fit a normal distribution? Explain.
Answer:
Question 28.
PROBLEM SOLVING
The guayule plant, which grows in the southwestern United States and in Mexico, is one of several plants that can be used as a source of rubber. In a large group of guayule plants, the heights of the plants are normally distributed with a mean of 12 inches and a standard deviation of 2 inches.

a. What percent of the plants are taller than 16 inches?
b. What percent of the plants are at most 13 inches?
c. What percent of the plants are between 7 inches and 14 inches?
d. What percent of the plants are at least 3 inches taller than or at least 3 inches shorter than the mean height?
Answer:
a. The percent of plants that are taller than 16 inches is about 2.28%
b. The percent of plants that are at most 13 inches is about 69.15%
c. The percent of plants between 7 and 14 inches is about 83.51%
d. The percent of plants that are at least 3 inches taller than or at least 3 inches shorter than the mean height is about 13.36%
Explanation:
a. The heights of the plants are normally distributed with μ = 12 in, σ = 2 in
z = \(\frac { x – μ }{ σ } \)
P(x≥16) = P(\(\frac { x – 12 }{ 2 } \)≥\(\frac { 16 – 12 }{ 2 } \)) = P(z≥2)
= 1 – P(z<2)
P(x≥16)= 1 – P(z<2) = 1 – 0.9772 = 0.0228
The percent of plants that are taller than 16 inches is about 2.28%
b. What percent of plants are at mos 13 inches = P(x≤13)
z = \(\frac { x – μ }{ σ } \)
P(x≤13) = P(\(\frac { x – 12 }{ 2 } \)≥\(\frac { 13 – 12 }{ 2 } \)) = P(z≤0.5)
P(x≤13) = P(z≤0.5) = 0.6915
The percent of plants that are at most 13 inches is about 69.15%
c. What percent of plants are between 7 and 14 inches = P(7≤x≤14)
P(7≤x≤14) = P(\(\frac { 7 – 12 }{ 2 } \) ≤ \(\frac { x – 12 }{ 2 } \) ≤ \(\frac { 14 – 12 }{ 2 } \))
= P(-2.5≤z≤1)
= P(z≤1) – P(z≤-2.5)
= 0.8413 – 0.0062 = 0.8351
The percent of plants between 7 and 14 inches is about 83.51%
d. What percent of plants are at least 3 inches taller than or at least 3 inches shorter than the mean weight
P(μ – 3 ≥ x ≥ μ + 3) = P(12 – 3 ≥ x ≥ 12 + 3)
= P(9 ≥ x ≥ 15)
= 1 – P(9≤x≤15)
P(9≤x≤15) = P(\(\frac { 9 – 12 }{ 2 } \) ≤ \(\frac { x – 12 }{ 2 } \) ≤ \(\frac { 15 – 12 }{ 2 } \))
= P(-1.5≤z≤1.5)
= P(z≤1.5) – P(z≤-1.5)
P(9 ≥ x ≥ 15) = 1 – P(z≤1.5) + P(z≤-1.5)
= 1 – 0.9332 + 0.0668
= 0.1336
The percent of plants that are at least 3 inches taller than or at least 3 inches shorter than the mean height is about 13.36%
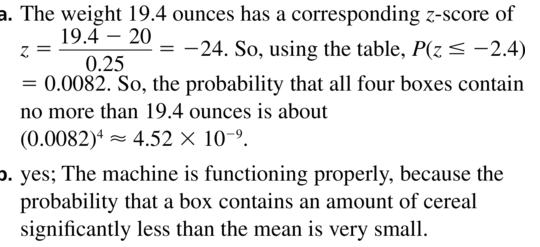
Question 29.
REASONING
Boxes of cereal are filled by a machine. Tests show that the amount of cereal in each box varies. The weights are normally distributed with a mean of 20 ounces and a standard deviation of 0.25 ounce. Four boxes of cereal are randomly chosen.
a. What is the probability that all four boxes contain no more than 19.4 ounces of cereal?
b. Do you think the machine is functioning properly? Explain.
Answer:
Question 30.
THOUGHT PROVOKING
Sketch the graph of the standard normal distribution function, given by
f (x) = \(\frac{1}{\sqrt{2} \pi}\)e−x2/2.
Estimate the area of the region bounded by the x-axis, the graph of f, and the vertical lines x =−3 and x = 3.
Answer:
P(-3≤z≤3) = 0.997
Explanation:
P(-3≤z≤3) = P(z≤3) – P(z≤-3)
P(z≤3) = 0.9987
P(z≤-3) = 0.0013
P(-3≤z≤3) = P(z≤3) – P(z≤-3)
= 0.9987 – 0.0013 = 0.997
Question 31.
REASONING
For normally distributed data, describe the value that represents the 84th percentile in terms of the mean and standard deviation.
Answer:
Question 32.
HOW DO YOU SEE IT?
In the figure, the shaded region represents 47.5% of the area under a normal curve. What are the mean and standard deviation of the normal distribution?
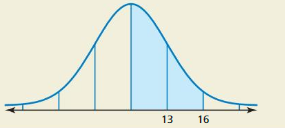
Answer:
Mean = 10
Standard deviation = 3
Explanation:
The shaded area represents 47.5% and since about 95% of the area lies within 2 standard deviations of the mean
47.5% = \(\frac { 95% }{ 2 } \)
μ + 2σ= 16
μ + σ = 13
Subtrcat both equations
μ + 2σ – μ – σ = 16 – 13
σ = 3
Substitute σ = 3 in one equation
μ + 3 = 13
μ = 10
Question 33.
DRAWING CONCLUSIONS
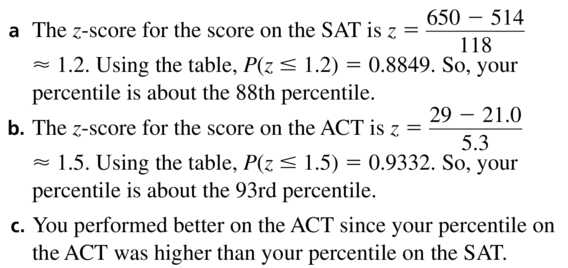
You take both the SAT (Scholastic Aptitude Test) and the ACT (American College Test). You score 650 on the mathematics section of the SAT and 29 on the mathematics section of the ACT. The SAT test scores and the ACT test scores are each normally distributed. For the SAT, the mean is 514 and the standard deviation is 118. For the ACT, the mean is 21.0 and the standard deviation is 5.3.
a. What percentile is your SAT math score?
b. What percentile is your ACT math score?c. On which test did you perform better? Explain your reasoning.
Answer:
Question 34.
WRITING
Explain how you can convert ACT scores into corresponding SAT scores when you know the mean and standard deviation of each distribution.
Answer:
If we know the ACt z-score and change it into the z-formula for SAT test, we can obtain an equivalent score by solving the equation we get.
Explanation:
Let’s suppose that SAT and ACT test scores are normally distributed with mean μs, μa and standard deviations σs, σa. Let’s convert the ACT scores into corresponding SAT scores when you know mean, SD of each distribution.
z-score of ACT is z<act>
P(xa < a) = P(\(\frac { xa – μa }{ σa } \) ≤ \(\frac { a – μa }{ σa } \)) = z<act>
P(xs < x) = z<act>
P(\(\frac { xs – μs }{ σs } \) ≤ \(\frac { X – μs }{ σs } \)) = z<act>
By solving the equation for x, we get the equivalent SAT score
Question 35.
MAKING AN ARGUMENT
A data set has a median of 80 and a mean of 90. Your friend claims that the distribution of the data is skewed left. Is your friend correct? Explain your reasoning.
Answer:
Question 36.
CRITICAL THINKING
The average scores on a statistics test are normally distributed with a mean of 75 and a standard deviation of 10. You randomly select a test score x. Find P (∣x−μ∣≥ 15 ).
Answer:
P(|x – μ| ≥ 15) = 0.1336
Explanation:
Lets suppose that statistical tests are normally distributed with μ = 75, σ = 101
P(|x – μ| ≥ 15) = 1 – P(|x – μ| ≤ 15)
= 1 – P(-15 ≤ x – μ ≤ 15)
= 1 – P(μ – 15 ≤ x ≤ μ + 15)
= 1 – P(x≤ μ + 15) – P(x≤ μ – 15)
= 1 – P(x≤ 75 + 15) – P(x≤ 75 – 15)
= 1 – P(x≤90) + P(x≤60)
z = \(\frac { x – μ }{ σ } \)
P(x≤90) = P(\(\frac { x – 75 }{ 10 } \) ≤\(\frac { 90 – 75 }{ 10 } \))
= P(z≤1.5)
= 0.9332
P(x≤60) = P(\(\frac { x – 75 }{ 10 } \) ≤\(\frac { 60 – 75 }{ 10 } \))
= P(z≤-1.5)
= 0.0668
P(|x – μ| ≥ 15) = 1 – P(x≤90) + P(x≤60)
= 1 – 0.9332 + 0.0668
= 0.1336
Maintaining Mathematical Proficiency
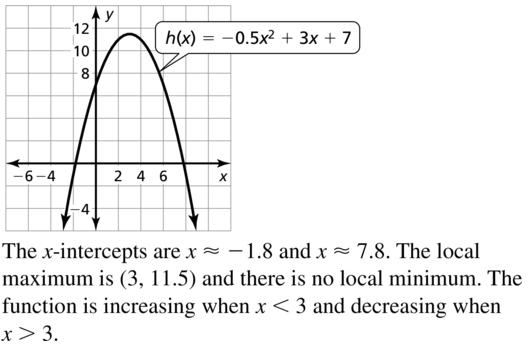
Graph the function. Identify the x-intercepts and the points where the local maximums and local minimums occur. Determine the intervals for which the function is increasing or decreasing.
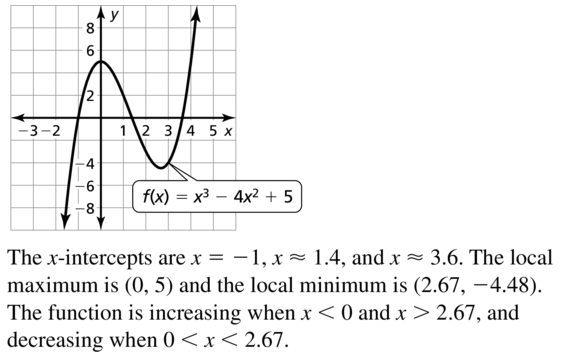
Question 37.
f(x) = x3 − 4x2+ 5
Answer:
Question 38.
g(x) = \(\frac{1}{4}\)x4 − 2x2−x − 3
Answer:
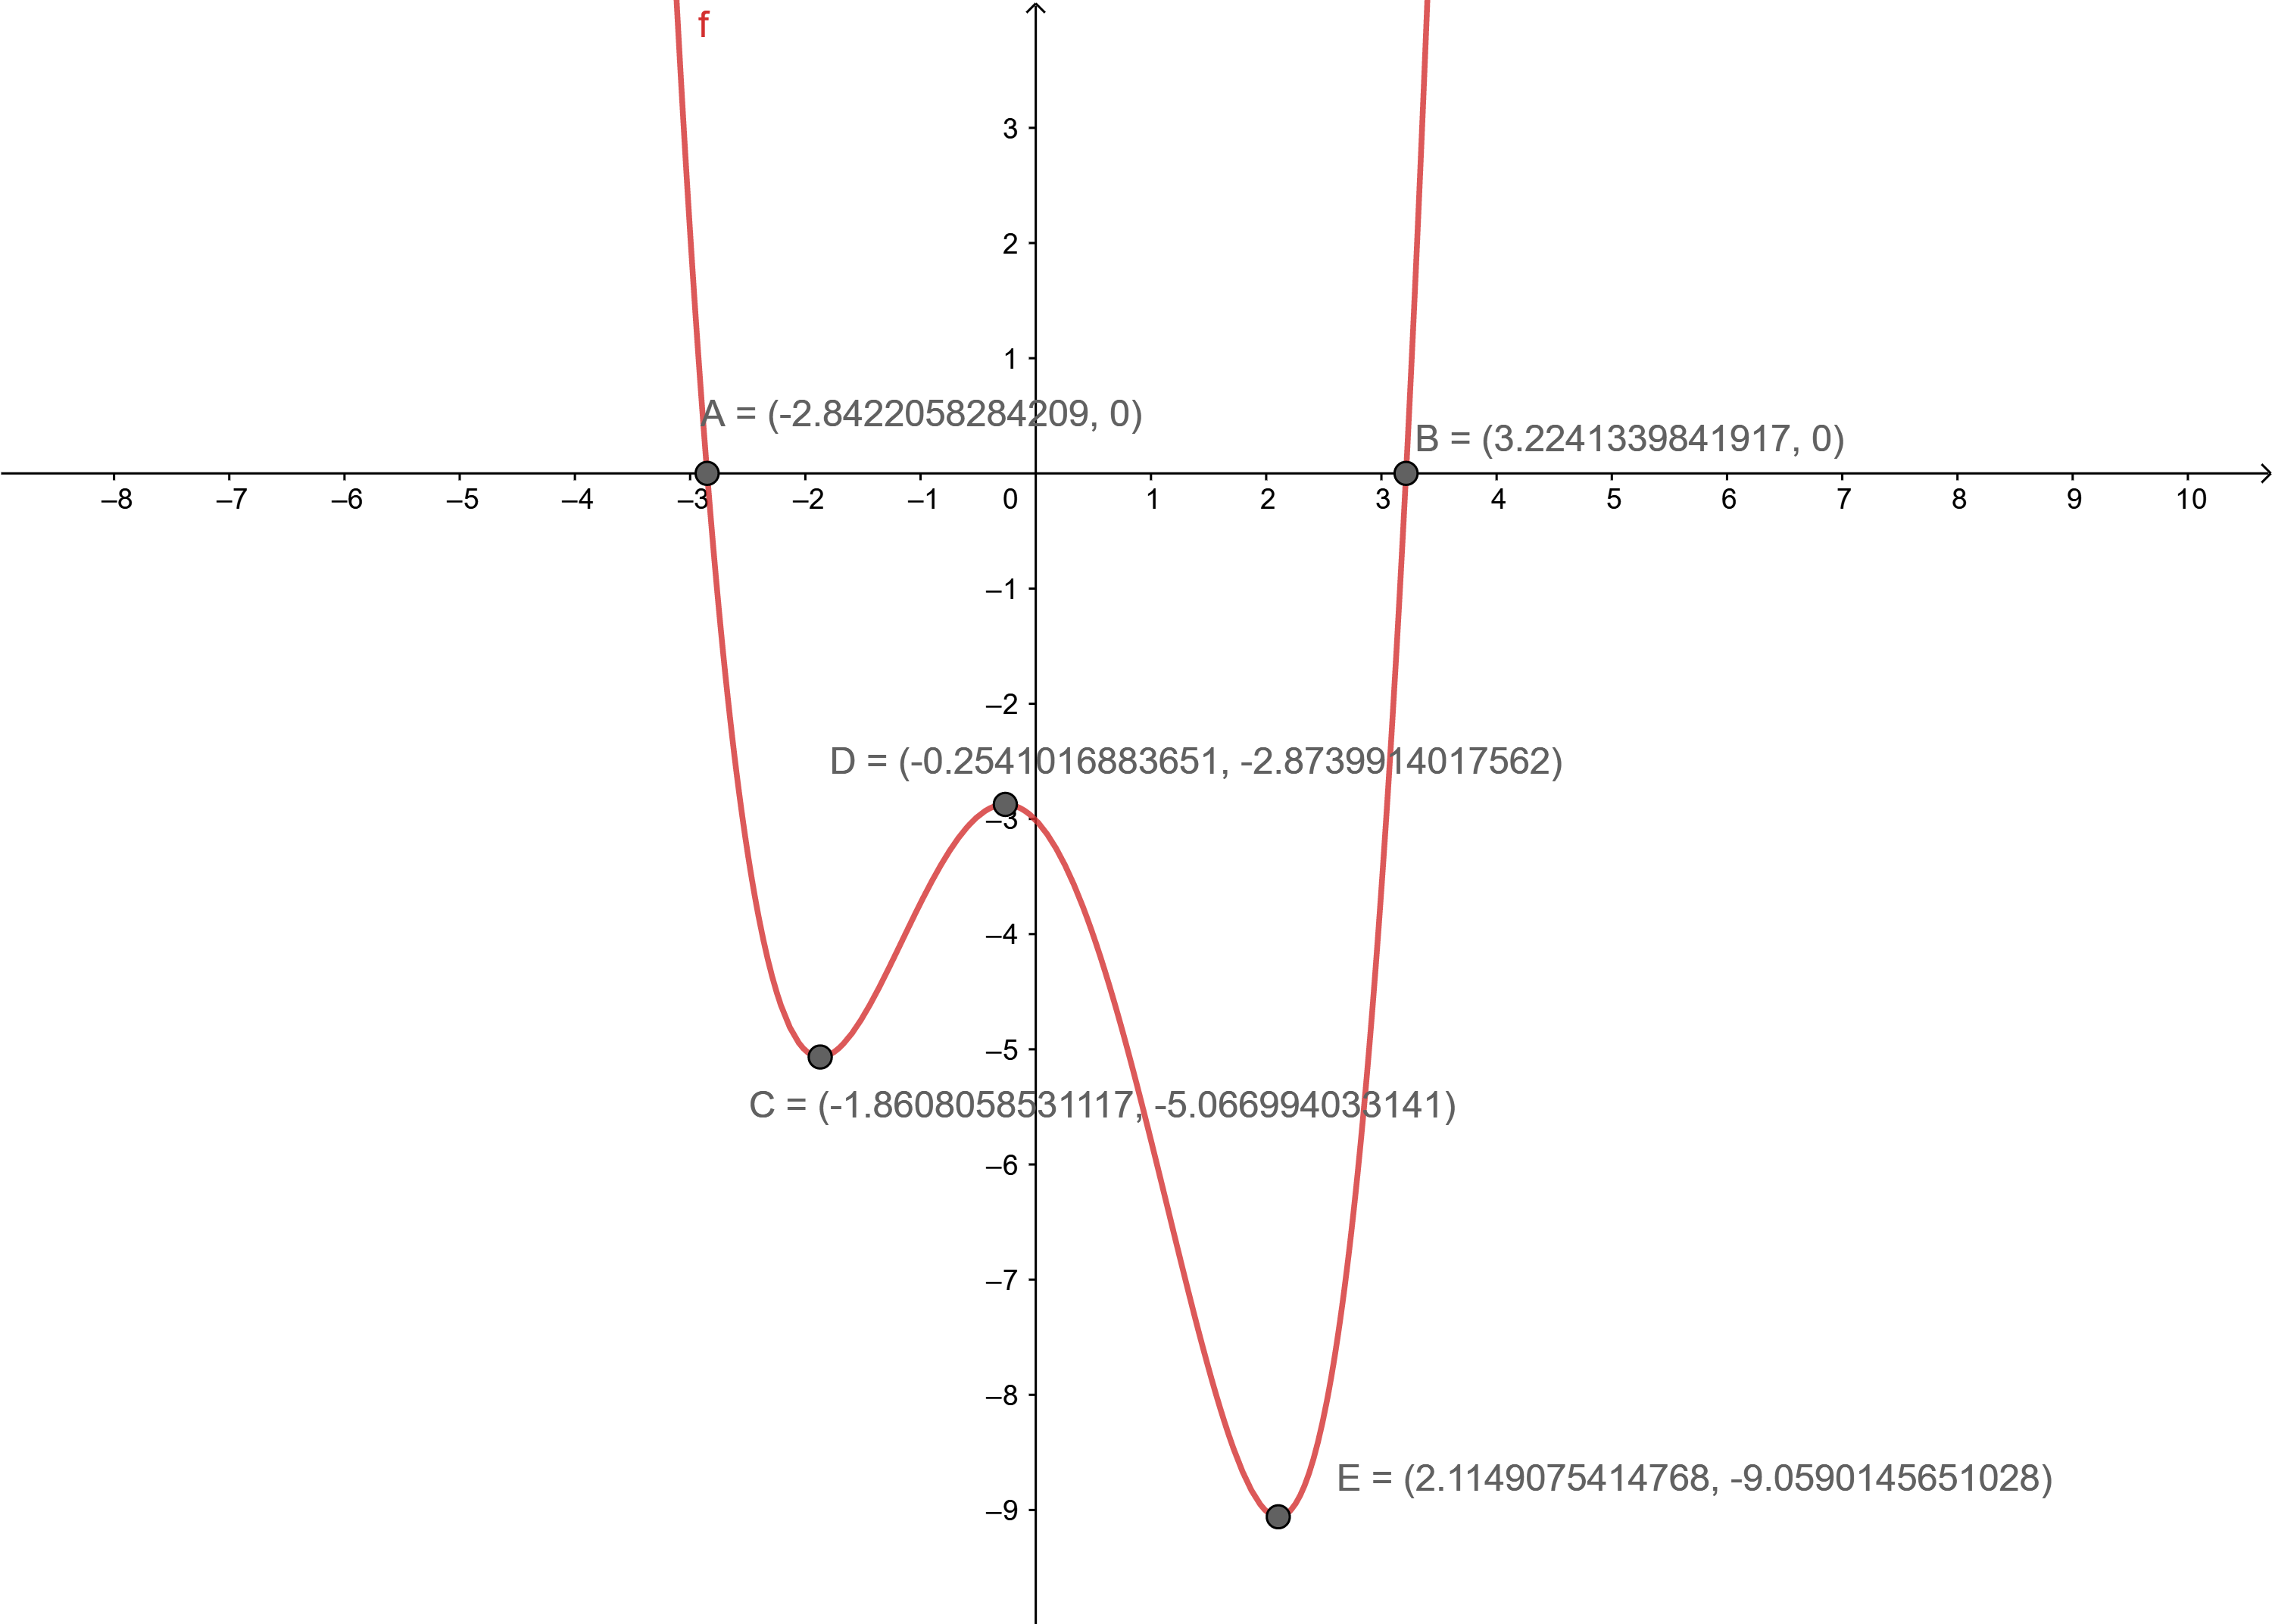
The x-intercepts are x = -2.8, x = 3.2
The local maximum value is -2.87, -5.07
The local minimum values are -1.86, -9.06
x∈(-∞, -1.86) U (-0.25, 2.11) function decreases
x ∈ (-1.86, -0.25) U(2.11, ∞) function increases.
Question 39.
h(x) = −0.5x2+ 3x + 7
Answer:
Question 40.
f(x) = −x4 + 6x2 − 13
Answer:
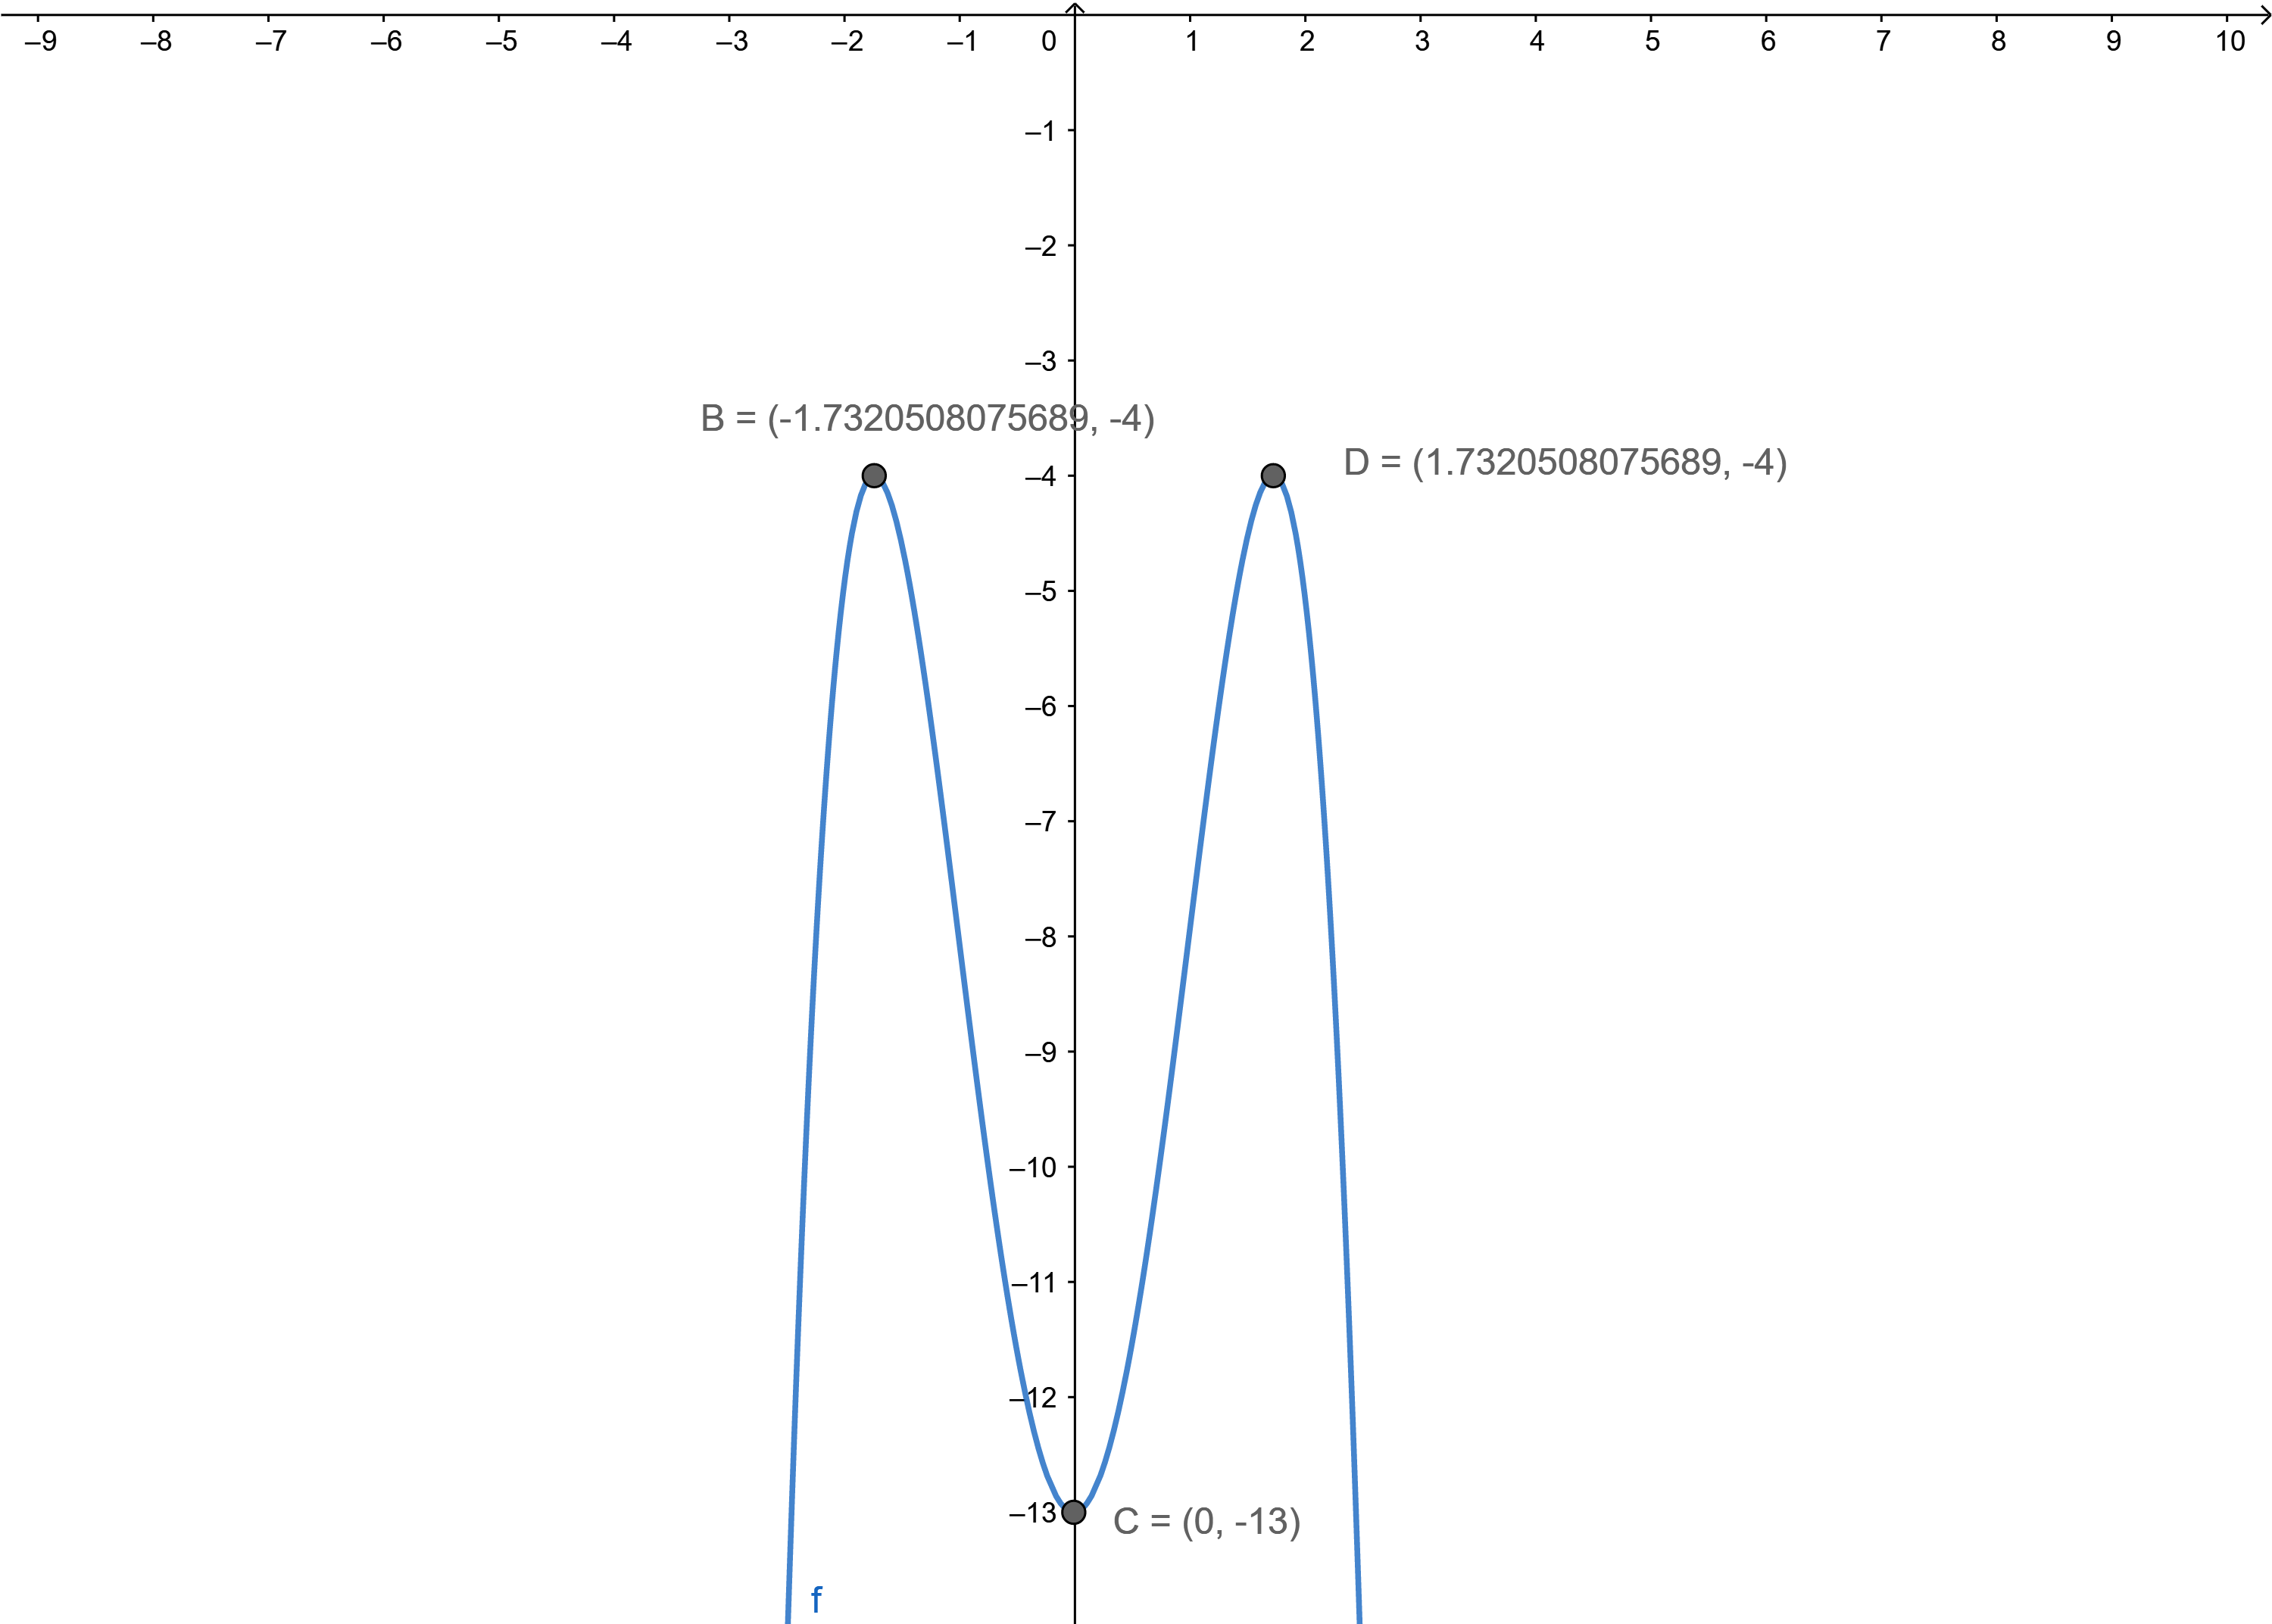
There are no x-intercepts
The local maximum values are -4, 4
The local minimum values are -173, 1.73
x∈(-∞, -1.73) U (0, 1.73) function increases
x ∈ (-1.73, 0) U(1.73, ∞) function decreases
Lesson 11.2 Populations, Samples, and Hypotheses
Essential Question How can you test theoretical probability using sample data?
EXPLORATION 1
Using Sample Data
Work with a partner.
a. When two six-sided dice are rolled, what is the theoretical probability that you roll the same number on both dice?
b. Conduct an experiment to check your answer in part (a). What sample size did you use? Explain your reasoning.
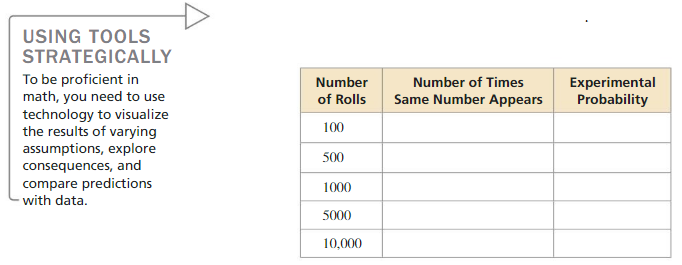
c. Use the dice rolling simulator at BigIdeasMath.com to complete the table. Do your experimental data check the theoretical probability you found in part (a)? Explain. What happens as you increase the sample size?
EXPLORATION 2
Using Sample Data
Work with a partner.
a. When three six-sided dice are rolled, what is the theoretical probability that you roll the same number on all three dice?
b. Compare the theoretical probability you found in part (a) with the theoretical probability you found in Exploration 1(a).
c. Conduct an experiment to check your answer in part (a). How does adding a die affect the sample size that you use? Explain your reasoning.
d. Use the dice rolling simulator at BigIdeasMath.com to check your answer to part (a). What happens as you increase the sample size?
Communicate Your Answer
Question 3.
How can you test theoretical probability using sample data?
Answer:
Theoretical probability is what is expected to happen based on mathematics.
P(event) = number of favorable outcomes/total number of possible outcomes.
A coin is tossed
P(head) = 1/2
P(tail) = 1/2.
Question 4.
Conduct an experiment to determine the probability of rolling a sum of 7 when two six-sided dice are rolled. Then find the theoretical probability and compare your answers.
Answer: The probability of getting sum as 7 when two dice are thrown is 1/6.
Monitoring Progress
In Monitoring Progress Questions 1 and 2, identify the population and the sample.
Question 1.
To estimate the retail prices for three grades of gasoline sold in the United States, the Energy Information Association calls 800 retail gasoline outlets, records the prices, and then determines the average price for each grade.
Answer:
In the population of all retail gasoline outlets, a sample of 800 retail gasoline outlets are chosen to participate in the survey.
Question 2.
A survey of 4464 shoppers in the United States found that they spent an average of $407.02 from Thursday through Sunday during a recent Thanksgiving holiday.
Answer:
In the population of all shoppers in the United States, a sample of 4464 shoppers are chosen to participate in the survey.
Question 3.
A survey found that the median salary of 1068 statisticians is about $72,800. Is the median salary a parameter or a statistic? Explain your reasoning.
Answer:
The median salary is a statistic.
Explanation:
Since the median salary is calculated for a sample of 1068 statisticians, not the entire population, this median salary cannot represent the whole population. Thus, it is a statistic.
Question 4.
The mean age of U.S. representatives at the start of the 113th Congress was about 57 years. Is the mean age a parameter or a statistic? Explain your reasoning.
Answer:
The average age is a parameter.
Explanation:
Since the average age is computed for all representatives, this average represents a parameter.
Question 5.
WHAT IF?
In Example 3, what should you conclude when you roll the actual die 50 times and get (a) 24 odd numbers and (b) 31 odd numbers?
Answer:
a. The makers claim is most likely true
b. The makers claim is most likely false.
Explanation:
a. Getting 24 odd numbers in 50 rolls corresponds to a proportion of \(\frac { 24 }{ 50 } \) = 0.48. In the simulation, this result has a relative frequency of 0.12. Most of the results are close to 0.50. Because this result can easily occur by chance, you can conclude that the makers claim is most likely true.
b. Getting 35 odd numbers in 50 rolls corresponds to a proportion of \(\frac { 31 }{ 50 } \) = 0.62. In the simulation, this result occurs with a small frequency which is about 0.02. Because getting 31 odd numbers is highly unlikely to occur by chance, you can conclude that the makers claim is most likely false.
Populations, Samples, and Hypotheses 11.2 Exercises
Vocabulary and Core Concept Check
Question 1.
COMPLETE THE SENTENCE
A portion of a population that can be studied in order to make predictions about the entire population is a(n) ___________.
Answer:
Question 2.
WRITING
Describe the difference between a parameter and a statistic. Give an example of each.
Answer:
Parameters are numbers that describe data for an entire population. Statistics are numbers that describe data from a sample i.e some subset of the entire population.
Question 3.
VOCABULARY
What is a hypothesis in statistics?
Answer:
Question 4.
WRITING
Describe two ways you can make an incorrect decision when analyzing a hypothesis.
Answer:
We have two types of errors. A type I error occurs if an investigator rejects a null hypothesis that is actually true in the population. A type II error occurs if the investigator fails to reject a null hypothesis that is actually false in the population.
Monitoring Progress and Modeling with Mathematics
In Exercises 5–8, determine whether the data are collected from a population or a sample. Explain your reasoning.
Question 5.
the number of high school students in the United States
Answer:

Question 6.
the color of every third car that passes your house
Answer:
It is a sample because it was counted as a subset of the entire population.
Question 7.
a survey of 100 spectators at a sporting event with 1800 spectators
Answer:
Question 8.
the age of each dentist in the United States
Answer:
It is a population because it’s counted the age of each dentist in the United States.
In Exercises 9–12, identify the population and sample. Describe the sample.
Question 9.
In the United States, a survey of 1152 adults ages 18 and over found that 403 of them pretend to use their smartphones to avoid talking to someone.

Answer:
Question 10.
In the United States, a survey of 1777 adults ages 18 and over found that 1279 of them do some kind of spring cleaning every year.
Answer:
In the population of all adults ages 18 and over in the United States, a sample of 1777 adults is surveyed.
Explanation:
In the population of all adults ages 18 and over in the United States, a sample of 1777 adults is surveyed. In the survey, 1279 of them do some kind of spring cleaning every year and 1777 – 1279 = 489 do not.
Question 11.
In a school district, a survey of 1300 high school students found that 1001 of them like the new, healthy cafeteria food choices.
Answer:
Question 12.
In the United States, a survey of 2000 households with at least one child found that 1280 of them eat dinner together every night.

Answer:
In the population of all households with at least one child in the United States, a sample of 2000 households is surveyed.
In Exercises 13–16, determine whether the numerical value is a parameter or a statistic. Explain your reasoning.
Question 13.
The average annual salary of some physical therapists in a state is $76,210.

Answer:
Question 14.
In a recent year, 53% of the senators in the United States Senate were Democrats.
Answer:
Since we have that 57 percent of all senators in the United States senate were Democrats, it represents a parameter.
Question 15.
Seventy-three percent of all the students in a school would prefer to have school dances on Saturday.
Answer:
Question 16.
A survey of U.S. adults found that 10% believe a cleaning product they use is not safe for the environment.
Answer:
since we have a survey where it’s found that 10% of some adults, not the entire population, believe that a cleaning product they use is not safe for the environment. Hence it is a statistic.
Question 17.
ERROR ANALYSIS
A survey of 1270 high school students found that 965 students felt added stress because of their workload. Describe and correct the error in identifying the population and the sample.
Answer:
Question 18.
ERROR ANALYSIS
Of all the players on a National Football League team, the mean age is 26 years. Describe and correct the error in determining whether the mean age represents a parameter or statistic. Because the mean age of 26 is based only on one football team, it is a statistic.
Answer:
Since we have that the mean age of all the players on a National Football League team is 26, the mean age represents a parameter not statistic.
Question 19.
MODELING WITH MATHEMATICS
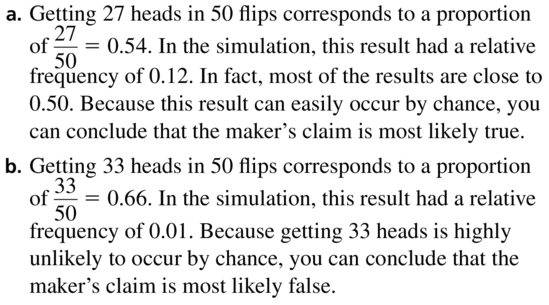
You flip a coin 4 times and do not get a tails. You suspect this coin favors heads. The coin maker claims that the coin doesnot favor heads or tails. You simulate flipping the coin 50 times by repeatedly drawing 200 random samples of size 50. The histogram shows the results. What should you conclude when you flip the actual coin 50 times and get (a) 27 heads and (b) 33 heads?
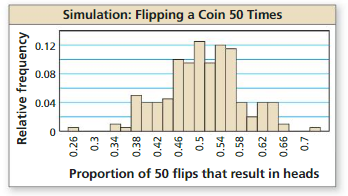
Answer:
Question 20.
MODELING WITH MATHEMATICS
Use the histogram in Exercise 19 to determine what you should conclude when you flip the actual coin 50 times and get (a) 17 heads and (b) 23 heads.
Answer:
a. the makers claim is most likely false.
b. The makers claim is most likely true.
Explanation:
a. Let’s suppose that we are flip the actual coin 50 times and get 17 heads. Getting 17 heads in 50 flipping corresponds to a proportion of \(\frac { 17 }{ 50 } \) = 0.34. In the simulation, this result occurs with a small frequency. Because getting 17 heads in highly unlikely to occur by chance, you can conclude that the makers claim is most likely false.
b. Let’s suppose that we are flip the actual coin 50 times and get 23 heads. Getting 23 heads in 50 flipping corresponds to a proportion of \(\frac { 23 }{ 50 } \) = 0.46. In the simulation, this result had a relative frequency of 0.10. In fact, most of the results are close to 0.50. Because getting this result can easily occur by chance, you can conclude that the makers claim is most likely true.
Question 21.
MAKING AN ARGUMENT
A random sample of five people at a movie theater from a population of 200 people gave the film 4 out of 4 stars. Your friend concludes that everyone in the movie theater would give the film 4 stars. Is your friend correct? Explain your reasoning.
Answer:
Question 22.
HOW DO YOU SEE IT?
Use the Venn diagram to identify the population and sample. Explain your reasoning.
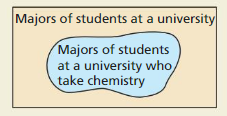
Answer:
A population will be a major of students at a university and the sample is the majors of students at a university that takes a chemistry.
Question 23.
OPEN-ENDED
Find a newspaper or magazine article that describes a survey. Identify the population and sample. Describe the sample.
Answer:
Question 24.
THOUGHT PROVOKING
You choose a random sample of 200 from a population of 2000. Each person in the sample is asked how many hours of sleep he or she gets each night. The mean of your sample is 8 hours. Is it possible that the mean of the entire population is only 7.5 hours of sleep each night? Explain.
Answer:
Yes, it is possible because the mean of your sample is 8 hours, which is very close to 7.5 hours. Also, the random sample of 200 people is enough big size of the sample to estimate the mean of the population.
Question 25.
DRAWING CONCLUSIONS
You perform two simulations of repeatedly selecting a marble out of a bag with replacement that contains three red marbles and three blue marbles. The first simulation uses 20 random samples of size 10, and the second uses 400 random samples of size 10. The histograms show the results. Which simulation should you use to accurately analyze a hypothesis? Explain.
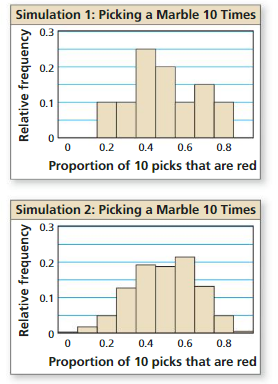
Answer:
Question 26.
PROBLEM SOLVING
You roll an eight-sided die five times and get a four every time. You suspect that the die favors the number four. The die maker claims that the die does not favor any number.
a. Perform a simulation involving 50 trials of rolling the actual die and getting a four to test the die maker’s claim. Display the results in a histogram.
b. What should you conclude when you roll the actual die 50 times and get 20 fours? 7 fours?
Answer:
b. 20 fours: Makers claim is most likely false
7 fours: Makers claim is most likely true.
Explanation:
Let’s suppose that we are rolling the eight side die 50 times and get 20 fours. Getting 20 fours in 50 rollings corresponds to a proportion of \(\frac { 20 }{ 50 } \) = 0.4. In the simulation, this result does not occur. Because getting 20 fours is highly unlikely to occur by chance, you can conclude that the makers claim is most likely false.
Let’s suppose that we are rolling the eight side die 50 times and get 7 fours. Getting 7 fours in 50 rollings corresponds to a proportion of \(\frac { 7 }{ 50 } \) = 0.14. In the simulation, this result had a relative frequency of 0.16. Because this result can easily occur by chance, you can conclude that the makers claim is most likely true
Maintaining Mathematical Proficiency
Solve the equation by completing the square.
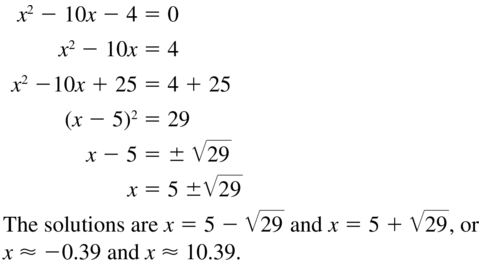
Question 27.
x2− 10x − 4 = 0
Answer:
Question 28.
3t2 + 6t = 18
Answer:
The solutions are -1 + √7, √7 + 1
Explanation:
3t² + 6t = 18
3t² + 6t – 180 = 0
3(t² + 2t) – 18 = 0
3(t² + 2t) – 18 + 3 – 3 = 0
3(t² + 2t + 1) – 21 = 0
3(t + 1)² – 21 = 0
3(t + 1)² = 21
(t + 1)² = 7
t + 1 = ±√7
t = ±√7 – 1
Question 29.
s2 + 10s + 8 = 0
Answer:
Solve the equation using the Quadratic Formula.
Question 30.
n2+ 2n + 2 = 0
Answer:
The solutions are -1 + i, -1 – i
Explanation:
n2+ 2n + 2 = 0
n² + 2n + 1 + 1 = 0
(n + 1)² + 1 = 0
(n + 1)²= -1
n + 1 = ±i
n = ±i – 1
Question 31.
4z2 + 28z = 15
Answer:
Question 32.
5w − w2 = −11
Answer:
The solutions of the equations are \(\frac { -5 + √69 }{ -2 } \), \(\frac { -5 – √69 }{ -2 } \)
Explanation:
w = \(\frac { -5 ± √(5² – 4(-1)(11)) }{ 2(-1) } \)
= \(\frac { -5 ± √(25 + 44) }{ -2 } \)
= \(\frac { -5 ± √69 }{ -2 } \)
The solutions of the equations are \(\frac { -5 + √69 }{ -2 } \), \(\frac { -5 – √69 }{ -2 } \)
Lesson 11.3 Collecting Data
Essential Question What are some considerations when undertaking a statistical study? The goal of any statistical study is to collect data and then use the data to make a decision. Any decision you make using the results of a statistical study is only as reliable as the process used to obtain the data. If the process is flawed, then the resulting decision is questionable.
EXPLORATION 1
Analyzing Sampling Techniques
Work with a partner. Determine whether each sample is representative of the population. Explain your reasoning.
a. To determine the number of hours people exercise during a week, researchers use random-digit dialing and call 1500 people.
b. To determine how many text messages high school students send in a week, researchers post a survey on a website and receive 750 responses.
c. To determine how much money college students spend on clothes each semester,a researcher surveys 450 college students as they leave the university library.
d. To determine the quality of service customers receive, an airline sends an e-mail survey to each customer after the completion of a flight.
EXPLORATION 2
Analyzing Survey Questions
Work with a partner. Determine whether each survey question is biased. Explain your reasoning. If so, suggest an unbiased rewording of the question.
a. Does eating nutritious, whole-grain foods improve your health?
b. Do you ever attempt the dangerous activity of texting while driving?
c. How many hours do you sleep each night?
d. How can the mayor of your city improve his or her public image?
EXPLORATION 3
Analyzing Survey Randomness and Truthfulness
Work with a partner. Discuss each potential problem in obtaining a random survey of a population. Include suggestions for overcoming the problem.
a. The people selected might not be a random sample of the population.
b. The people selected might not be willing to participate in the survey.
c. The people selected might not be truthful when answering the question.
d. The people selected might not understand the survey question.
Communicate Your Answer
Question 4.
What are some considerations when undertaking a statistical study?
Answer:
The few considerations when undertaking a statistical study are as follows
a. what is the research question?
b. What is the study design?
c. What is the level of measurement?
Question 5.
Find a real-life example of a biased survey question. Then suggest an unbiased rewording of the question.
Answer:
Monitoring Progress
Question 1.
WHAT IF?
In Example 1, you divide the students in your school according to their zip codes, then select all of the students that live in one zip code. What type of sample are you using?
Answer:
A cluster sample.
Explanation:
We divide the students in our school according to their zip codes, then select all of the students that live in one zip code. Thus, we have a cluster sample.
Question 2.
Describe another method you can use to obtain a stratified sample in Example 1.
Answer:
Students can be divided into several groups so that the grade point average of students among the groups is similar. Then, we can randomly select 3 students from each group and thus form a sample.
Question 3.
The manager of a concert hall wants to know how often people in the community attend concerts. The manager asks 45 people standing in line for a rock concert how many concerts they attend per year. Identify the type of sample the manager is using and explain why the sample is biased.
Answer:
A convenience sample.
Explanation:
Since the manager asks 45 people which stand in line for a rock concert it is a convenience sample because only members of a population who are easy to reach are asked. The sample is biased because the people asked intended to go to a concert.
Question 4.
In Example 3, what is another method you can use to generate a random sample of 50 students? Explain why your sampling method is random.
Answer:
We can write the names of all the students on paper and put them in a hat. Then we can take 50 papers out of the hat and form a pattern. It’s a random sample because we don’t know which piece of paper we are going to pull out of the hat.
Explanation:
We have 246 seniors and we have to randomly select 50 students. For example, we can write the names of all the students on paper and put them in a hat. Then we can take 50 papers out of the hat and form a pattern. It’s a random sample because we don’t know which piece of paper we are going to pull out of the hat.
Identify the method of data collection the situation describes.
Question 5.
Members of a student council at your school ask every eighth student who enters the cafeteria whether they like the snacks in the school’s vending machines.
Answer:
Since every eighth student who enters the cafeteria is asked for an opinion, we have a survey.
Question 6.
A park ranger measures and records the heights of trees in a park as they grow.
Answer:
Since we have a park ranger that measures and record the heights of trees in a park as they grow, we have an observational study.
Question 7.
A researcher uses a computer program to help determine how fast an influenza virus might spread within a city.
Answer:
Since we have that researcher collecting data by using the computer, we have a simulation.
Question 8.
Explain why the survey question below may be biased or otherwise introduce bias into the survey. Then describe a way to correct the flaw.
“Do you agree that our school cafeteria should switch to a healthier menu?”
Answer:
The question is biased because it encourages the answer yes.
Collecting Data 11.3 Exercises
Vocabulary and Core Concept Check
Question 1.
VOCABULARY
Describe the difference between a stratified sample and a cluster sample.
Answer:
Question 2.
COMPLETE THE SENTENCE
A sample for which each member of a population has an equal chance of being selected is a(n) __________ sample.
Answer:
A sample for which each member of a population has an equal chance of being selected is random sample.
Question 3.
WRITING
Describe a situation in which you would use a simulation to collect data.
Answer:
Question 4.
WRITING
Describe the difference between an unbiased sample and a biased sample. Give one example of each.
Answer:
The difference between an unbiased sample and a biased sample is that an unbiased sample is collecting the data from a population that you want information about, the biased sample is a non-random sample of a population in which all individuals, or instances were not equally likely to have been selected.
Monitoring Progress and Modeling with Mathematics
In Exercises 5–8, identify the type of sample described.
Question 5.
The owners of a chain of 260 retail stores want to assess employee job satisfaction. Employees from 12 stores near the headquarters are surveyed.
Answer:
Question 6.
Each employee in a company writes their name on a card and places it in a hat. The employees whose names are on the first two cards drawn each win a gift card.
Answer:
Since each of the employees in a company has the same chances to be drawn, we have the random sample.
Question 7.
A taxicab company wants to know whether its customers are satisfied with the service. Drivers survey every tenth customer during the day.
Answer:
Question 8.
The owner of a community pool wants to ask patrons whether they think the water should be colder. Patrons are divided into four age groups, and a sample is randomly surveyed from each age group.
Answer:
Since the patrons are divided into four age groups and a sample is randomly surveyed from each age group, we have a stratified sample.
In Exercises 9–12, identify the type of sample and explain why the sample is biased.
Question 9.
A town council wants to know whether residents support having an off-leash area for dogs in the town park. Eighty dog owners are surveyed at the park.

Answer:
Question 10.
A sportswriter wants to determine whether baseball coaches think wooden bats should be mandatory in collegiate baseball. The sportswriter mails surveys to all collegiate coaches and uses the surveys that are returned.
Answer:
Since the participants in the survey are collegiate coaches and use the surveys that are returned, we have the self-selected sample.
Question 11.
You want to find out whether booth holders at a convention were pleased with their booth locations. You divide the convention center into six sections and survey every booth holder in the fifth section.
Answer:
Question 12.
Every tenth employee who arrives at a company health fair answers a survey that asks for opinions about new health-related programs.
Answer:
Since every tenth employee who arrives at a company health fair answers a survey, it is a systematic sample.
Question 13.
ERROR ANALYSIS
Surveys are mailed to every other household in a neighborhood. Each survey that is returned is used. Describe and correct the error in identifying the type of sample that is used.

Answer:
Question 14.
ERROR ANALYSIS
A researcher wants to know whether the U.S. workforce supports raising the minimum wage. Fifty high school students chosen at random are surveyed. Describe and correct the error in determining whether the sample is biased.

Answer:
we have fifty high school students chosen at random are surveyed. Since the sample is not chosen from the entire population it cannot be a non-biased sample. Thus, a sample is biased.
In Exercises 15–18, determine whether the sample is biased. Explain your reasoning.
Question 15.
Every third person who enters an athletic event is asked whether he or she supports the use of instant replay in officiating the event.
Answer:
Question 16.
A governor wants to know whether voters in the state support building a highway that will pass through a state forest. Business owners in a town near the proposed highway are randomly surveyed.
Answer:
Participants in the survey are only random business owners in a town near the proposed highway and they cannot represent the whole population of the town, so it is a biased sample.
Question 17.
To assess customers’ experiences making purchases online, a rating company e-mails purchasers and asks that they click on a link and complete a survey.
Answer:
Question 18.
Your school principal randomly selects five students from each grade to complete a survey about classroom participation.
Answer:
Since we chose 5 students from each grade to complete a survey about classroom participation, the sample represents the whole population. Thus, the sample is not biased.
Question 19.
WRITING
The staff of a student newsletter wants to conduct a survey of the students’ favorite television shows. There are 1225 students in the school. Describe a method for selecting a random sample of 250 students to survey.

Answer:
Question 20.
WRITING
A national collegiate athletic association wants to survey 15 of the 120 head football coaches in a division about a proposed rules change. Describe a method for selecting a random sample of coaches to survey.
Answer:
We can divide 120 coaches into three groups with the 40 coaches, and from each group choose 5 coaches. Now, for example we can denote each coach from the group by some integer number from 1 to 40, and by using the random integer generator chooses 5 coaches. On the described way, from all 3 groups we can choose 15 coaches.
In Exercises 21–24, identify the method of data collection the situation describes.
Question 21.
A researcher uses technology to estimate the damage that will be done if a volcano erupts.

Answer:

Question 22.
The owner of a restaurant asks 20 customers whether they are satisfied with the quality of their meals.
Answer:
The owner of a restaurant asks 20 customers whether they are satisfied with the quality of their meals which is an investigation of one or more characteristics of a population. Thus, we have a survey.
Question 23.
A researcher compares incomes of people who live in rural areas with those who live in large urban areas.
Answer:
Question 24.
A researcher places bacteria samples in two different climates. The researcher then measures the bacteria growth in each sample after 3 days.
Answer:
A researcher places bacteria samples in two different climates. The researcher then measures the bacteria growth in each sample after 3 days. Thus, we have a treatment on individuals in order to collect data on their respone to the treatment. Thus, we have an experiment.
In Exercises 25–28, explain why the survey question may be biased or otherwise introduce bias into the survey. Then describe a way to correct the flaw.
Question 25.
“Do you agree that the budget of our city should be cut?”
Answer:
Question 26.
“Would you rather watch the latest award-winning movie or just read some book?”
Answer:
The question favors the answer that you rather watch the movie.
Question 27.
“The tap water coming from our western water supply contains twice the level of arsenic of water from our eastern supply. Do you think the government should address this health problem?”
Answer:
Question 28.
A child asks, “Do you support the construction of a new children’s hospital?”
Answer:
The question favors the answer yes (plus you are asked by the child about the children’s hospital).
In Exercises 29–32, determine whether the survey question may be biased or otherwise introduce bias into the survey. Explain your reasoning.
Question 29.
“Do you favor government funding to help prevent acid rain?”
Answer:
Question 30.
“Do you think that renovating the old town hall would be a mistake?”
Answer:
The question is biased because it is si set that encourages the answer yes.
Question 31.
A police officer asks mall visitors, “Do you wear your seat belt regularly?”
Answer:
Question 32.
“Do you agree with the amendments to the Clean Air Act?”
Answer:
The question is not biased because it is asked without much information in it so that the right opinion of the survey participants can be obtained.
Question 33.
REASONING
A researcher studies the effect of fiber supplements on heart disease. The researcher identified 175 people who take fiber supplements and 175 people who do not take fiber supplements. The study found that those who took the supplements had 19.6% fewer heart attacks. The researcher concludes that taking fiber supplements reduces the chance of heart attacks.

a. Explain why the researcher’s conclusion may not be valid.
b. Describe how the researcher could have conducted the study differently to produce valid results.
Answer:
Question 34.
HOW DO YOU SEE IT?
A poll is conducted to predict the results of a statewide election in New Mexico before all the votes are counted. Fifty voters in each of the state’s 33 counties are asked how they voted as they leave the polls.
a. Identify the type of sample described.
b. Explain how the diagram shows that the polling method could result in a biased sample.
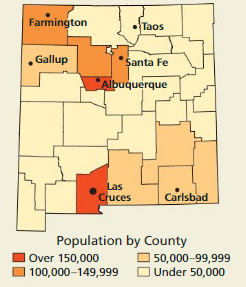
Answer:
a. Stratified sample
b. With the date of the damp, we can notice that different countries have different populations. The sample consists of an equal number of respondents from each country and the number of respondents from the country is not proportional to the size of the country. Therefore, a small sample from a country with a large population cannot be considered credible.
Question 35.
WRITING
Consider each type of sample listed on page 610. Which of the samples are most likely to lead to biased results? Explain.
Answer:
Question 36.
THOUGHT PROVOKING
What is the difference between a “blind experiment” and a “double-blind experiment?” Describe a possible advantage of the second type of experiment over the first.
Answer:
Double blind experiments are particularly useful for preventing bias due to demand characteristics or the placebo effect which represent a possible advantage of double blind experiments.
Explanation:
In a blind or blind experiment, information that may influence the participants of the experiment is withheld until after the experiment is complete. A double blind experiment is one in which neither the participant nor the experimenters know who is receiving a particular treatment. this procedure is utilized to prevent bias in research results. double blind experiments are particularly useful for preventing bias due to demand characteristics or the placebo effect which represent a possible advantage of double blind experiments.
Question 37.
WRITING
A college wants to survey its graduating seniors to find out how many have already found jobs in their field of study after graduation.
a. What is the objective of the survey?
b. Describe the population for the survey.
c. Write two unbiased questions for the survey.
Answer:
Question 38.
REASONING
About 3.2% of U.S. adults follow a vegetarian-based diet. Two randomly selected groups of people were asked whether they follow such a diet. The first sample consists of 20 people and the second sample consists of 200 people. Which sample proportion is more likely to be representative of the national percentage? Explain.
Answer:
The larger sample (second sample) will better represent the whole population because some unusual responses will not affect the results much as with the smaller sample (first sample).
Question 39.
MAKING AN ARGUMENT
The U.S. Census is taken every10 years to gather data from the population. Your friend claims that the sample cannot be biased. Is your friend correct? Explain.
Answer:
Question 40.
OPEN-ENDED
An airline wants to know whether travelers have enough leg room on its planes.

a. What method of data collection is appropriate for this situation?
b. Describe a sampling method that is likely to give biased results. Explain.
c. Describe a sampling method that is not likely to give biased results. Explain.
d. Write one biased question and one unbiased question for this situation.
Answer:
a. Survey
b. Description of an biased method
c. Description of an not biased method
d. Biased question: “Do you agree that legroom is too small?”
Non biased question: “Do you have enough legroom?”
Explanation:
a. In this situation, a survey is an excellent method for collecting the data.
b. We can conduct the survey by mail. Only people with strong opinions about the legroom on its planers will take part in that survey and return the survey by mail.
c. For example, in order to obtan a not-biased in a survey, an airline may grant a certain discount on tickets if it participates in the survey in all class seats. That way more people will take part in the survey and we will get an unbiased sample.
d. Biased question: “Do you agree that legroom is too small?”
Non biased question: “Do you have enough legroom?”
Question 41.
REASONING
A website contains a link to a survey that asks how much time each person spends on the Internet each week.
a. What type of sampling method is used in this situation?
b. Which population is likely to respond to the survey? What can you conclude?
Answer:
Maintaining Mathematical Proficiency
Evaluate the expression without using a calculator.
Question 42.
45/2
Answer:
45/2 = 32
Explanation:
45/2 = (22)\(\frac { 5 }{ 2 } \)
= 2 2 . \(\frac { 5 }{ 2 } \)
= 25
= 32
Question 43.
272/3
Answer:
![]()
Question 44.
−641/3
Answer:
−641/3 = -4
Explanation:
−641/3 = -((4)3)1/3
= -43 . 1/3
= -4
Question 45.
8-2/3
Answer:
Simplify the expression.
Question 46.
(43/2 • 41/4)4
Answer:
(43/2 • 41/4)4 = 16384
Explanation:
(43/2 • 41/4)4 = (43/2 + 1/4)4
= (47/4>/sup>)4
= 47/4 . 4
= 47
= 16384
Question 47.
(61/3 • 31/3)-2
Answer:
![]()
Question 48.
\(\sqrt [ 3 ]{ 4 }\) • \(\sqrt [ 3 ]{ 16 }\)
Answer:
\(\sqrt [ 3 ]{ 4 }\) • \(\sqrt [ 3 ]{ 16 }\) = 4
Explanation:
\(\sqrt [ 3 ]{ 4 }\) • \(\sqrt [ 3 ]{ 16 }\) = \(\sqrt [ 3 ]{ 4 }\) • \(\sqrt [ 3 ]{ 4² }\)
= 41/3 + 42/3
= 41/3 + 2/3
= 4
Question 49.
\(\frac{\sqrt[4]{405}}{\sqrt[4]{5}}\)
Answer:
Data Analysis and Statistics Study Skills: Reworking Your Notes
11.1–11.3 What Did You Learn?
Core Vocabulary
Core Concepts
Mathematical Practices
Question 1.
What previously established results, if any, did you use to solve Exercise 31 on page 602?
Answer:
Question 2.
What external resources, if any, did you use to answer Exercise 36 on page 616?
Answer:
Study Skills: Reworking Your Notes
It’s almost impossible to write down in your notes all the detailed information you are taught in class. A good way to reinforce the concepts and put them into your long-term memory is to rework your notes. When you take notes, leave extra space on the pages. You can go back after class and fill in:
- important definitions and rules
- additional examples
- questions you have about the material

Data Analysis and Statistics 11.1–11.3 Quiz
A normal distribution has a mean of 32 and a standard deviation of 4. Find the probability that a randomly selected x-value from the distribution is in the given interval.
Question 1.
at least 28
Answer:
P(x > 28) = 84%
Explanation:
Mean μ = 32
σ = 4
We have to determine P(x > 28)
28 is one standard deviation to the left of the mean
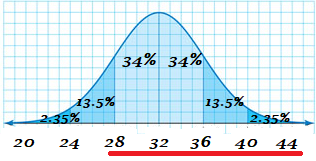
P(x > 28) = P(x > μ – σ)
= 34% + 34% + 13.5% + 2.35% + 0.015%
= 84%
Question 2.
between 20 and 32
Answer:
The probability is 0.4985
Explanation:
Let’s suppose that a normal distribution has a mean of μ = 32, σ = 4
Consider the following
μ – 20 = 32 – 20 = 12 = 3 . 4 = 3σ
20 = μ – 3σ
32 – μ = 32 – 32 = 0
32 = μ
P(20≤x≤32) = P(μ – 3σ≤x≤μ)
= P(x≤μ) – P(x≤μ – 3σ)
= 0.5 – 0.0015
= 0.4985
Question 3.
at most 26
Answer:
The probability is 0.0668. (6.68%)
Explanation:
Let’s suppose that a normal distribution has a mean of μ = 32, σ = 4
Now compute P(x≤26)
z = \(\frac { x – μ }{ σ } \)
P(x≤26) = P(\(\frac { x – 32 }{ 4 } \)≤ \(\frac { 26 – 32 }{ 4 } \))
= P(z≤-1.5)
= 0.0668
Question 4.
at most 35
Answer:
The probability is 0.7881
Explanation:
Let’s suppose that a normal distribution has a mean of μ = 32, σ = 4
Now compute P(x≤35)
z = \(\frac { x – μ }{ σ } \)
P(x≤35) = P(\(\frac { x – 32 }{ 4 } \)≤ \(\frac { 35 – 32 }{ 4 } \))
= P(z≤0.8)
= 0.7881
Determine whether the histogram has a normal distribution.
Question 5.
Answer:
Yes
Question 6.
Answer:
No
Question 7.
A survey of 1654 high school seniors determined that 1125 plan to attend college. Identify the population and the sample. Describe the sample.
Answer:
Population: Al high school students
Explanation:
Sample: The 1654 high school seniors surveyed. The sample consists of 1125 high school seniors who plan to attend college and 529 high school seniors who do not.
Question 8.
A survey of all employees at a company found that the mean one-way daily commute to work of the employees is 25.5 minutes. Is the mean time a parameter or a statistic? Explain your reasoning.
Answer:
Parameter
Explanation:
The entire population was surveyed.
Question 9.
A researcher records the number of bacteria present in several samples in a laboratory. Identify the method of data collection.
Answer:
Observational study
Question 10.
You spin a five-color spinner, which is divided into equal parts, five times and every time the spinner lands on red. You suspect the spinner favors red. The maker of the spinner claims that the spinner does not favor any color. You simulate spinning the spinner 50 times by repeatedly drawing 200 random samples of size 50. The histogram shows the results. Use the histogram to determine what you should conclude when you spin the actual spinner 50 times and the spinner lands on red (a) 9 times and (b) 19 times.
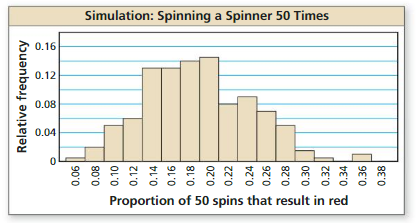
Answer:
a) The marker’s claim is most likely true
b) The marker’s claim is most likely false
Question 11.
A local television station wants to find the number of hours per week people in the viewing area watch sporting events on television. The station surveys people at a nearby sports stadium.
a. Identify the type of sample described.
b. Is the sample biased? Explain your reasoning.
c. Describe a method for selecting a random sample of 200 people to survey.
Answer:
a) Convenience sample
b) Yes, people at a sports stadium are more likely to watch more sports on television than people who never go to a sports stadium.
c) Randomly pick 200 members from the seating area by placing all seat numbers in a hat.
Lesson 11.4 Experimental Design
Essential Question How can you use an experiment to test a conjecture?
EXPLORATION 1
Using an Experiment
Work with a partner. Standard white playing dice are manufactured with black dots that are indentations, as shown. So, the side with six indentations is the lightest side and the side with one indentation is the heaviest side.
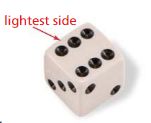
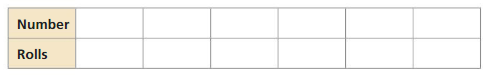
You make a conjecture that when you roll a standard playing die, the number 6 will come up more often than the number 1 because 6 is the lightest side. To test your conjecture, roll a standard playing die 25 times. Record the results in the table. Does the experiment confirm your conjecture? Explain your reasoning.
EXPLORATION 2
Analyzing an Experiment
Work with a partner. To overcome the imbalance of standard playing dice, one of the authors of this book invented and patented 12-sided dice, on which each number from 1 through 6 appears twice (on opposing sides). See BigIdeasMath.com.
As part of the patent process, a standard playing die was rolled 27,090 times. The results are shown below.
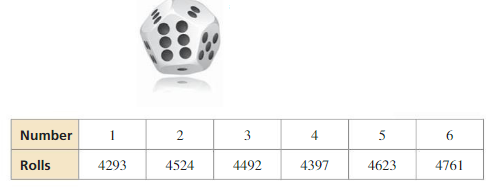
What can you conclude from the results of this experiment? Explain your reasoning.
Communicate Your Answer
Question 3.
How can you use an experiment to test a conjecture?
Answer:
Question 4.
Exploration 2 shows the results of rolling a standard playing die 27,090 times to test the conjecture in Exploration 1. Why do you think the number of trials was so large?
Answer:
Question 5.
Make a conjecture about the outcomes of rolling the 12-sided die in Exploration 2. Then use the Internet to find a 12-sided die rolling simulator. Use the simulator to complete a table similar to the one shown below. How many times did you simulate rolling the die? Explain your reasoning.
Answer:
Monitoring Progress
Question 1.
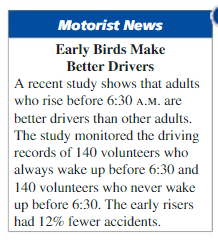
Determine whether the study is a randomized comparative experiment. If it is, describe the treatment, the treatment group, and the control group. If it is not, explain why not and discuss whether the conclusions drawn from the study are valid.
Answer:
The study is a randomized comparative experiment.
Explanation:
The study is a randomized comparative experiment because we have a treatment that is accident reduction, the treatment group are people who got up before 6:30, and the control group are people who never wake up before 6:30.
Question 2.
Determine whether the following research topic is best investigated through an experiment or an observational study. Then describe the design of the experiment or observational study.
You want to know whether flowers sprayed twice per day with a mist of water stay fresh longer than flowers that are not sprayed.
Answer:
Experimental study
Explanation:
It is better to use an experimental study. The treatment will be, spraying twice per day with a mist of water, the control group will be flowers that don’t sprayed, the treatment group will be flowers that will be sprayed.
Question 3.
In Example 3, the company identifies 250 people who are overweight. The subjects are randomly assigned to a treatment group or a control group. In addition, each subject is given a DVD that documents the dangers of obesity. After 3 months, most of the subjects placed in the treatment group have lost weight. Identify a potential problem with the experimental design. Then describe how you can improve it.
Answer:
A potential problem is that each subject is given a DVD documenting the dangers of obesity because in that case, we have no difference between the control and treatment group. To improve the experiment, A DVD documenting the dangers of obesity should only be given to obese people in the treatment group.
Question 4.
You design an experiment to test the effectiveness of a vaccine against a strain of influenza. In the experiment, 100,000 people receive the vaccine and another 100,000 people receive a placebo. Identify a potential problem with the experimental design. Then describe how you can improve it.
Answer:
A potential problem is in choosing people who have been vaccinated.
Explanation:
A potential problem is in choosing people who have been vaccinated. for example, some people who may have a stronger immune system and who will not need the vaccine or have a weak immune system and get sick more easily. We can improve the experiment by randomly selecting 200,000 people with similar immune systems and forming two groups of them one of which will be vaccinated and the other will receive a placebo.
Experimental Design 11.4 Exercises
Vocabulary and Core Concept Check
Question 1.
COMPLETE THE SENTENCE
Repetition of an experiment under the same or similar conditions is called _________.
Answer:
Question 2.
WRITING
Describe the difference between the control group and the treatment group in a controlled experiment.
Answer:
Let’s give an example to see the difference. The experimental group, also known as the treatment group, receives treatment whose effect the researchers want to study, while the control group does not. You should include in the experiment a control group that is identical to the group that treats in every way, except that it does not receive experimental treatment.
Monitoring Progress and Modeling with Mathematics
In Exercises 3 and 4, determine whether the study is a randomized comparative experiment. If it is, describe the treatment, the treatment group, and the control group. If it is not, explain why not and discuss whether the conclusions drawn from the study are valid.
Question 3.
Answer:
Question 4.

Answer:
The study is not a randomized comparative experiment because the students were not randomly assigned to the control group and treatment group. The conclusion may or may not be valid because there may be other reasons students have fewer cavities, such as better oral health practices.
ERROR ANALYSIS In Exercises 5 and 6, describe and correct the error in describing the study.
A company’s researchers want to study the effects of adding shea butter to their existing hair conditioner. They monitor the hair quality of 30 randomly selected customers using the regular conditioner and 30 randomly selected customers using the new shea butter conditioner.
Question 5.

Answer:
Question 6.

Answer:
The study cannot be an observational study because the variable is controlled (we have a control group). Thus, it is a randomized comparative experiment.
In Exercises 7–10, explain whether the research topic is best investigated through an experiment or an observational study. Then describe the design of the experiment or observational study.
Question 7.
A researcher wants to compare the body mass index of smokers and nonsmokers.
Answer:
Question 8.
A restaurant chef wants to know which pasta sauce recipe is preferred by more diners.
Answer:
Experiment
Explanation:
Since a restaurant chef wants to know which pasta sauce recipe is preferred by more diners, he can randomly choose two groups, the control and the treatment group. So, use an experiment. Hence, a restaurant chef can randomly choose guests and form two groups. Then, to one group chef can serve a new asta sauce from one recipe, and for another group, he can serve a pasta sauce made by suing some other recipe. After that, he can survey guests from both groups to see which recipe is more likely.
Question 9.
A farmer wants to know whether a new fertilizer affects the weight of the fruit produced by strawberry plants.
Answer:
Question 10.
You want to know whether homes that are close to parks or schools have higher property values.
Answer:
An observational study.
Explanation:
We have homes that are close to parks and schools that are not. Thus, we cannot randomly form two groups and because of that, we will use an observational study. First, we can randomly choose homes close to the park and school and form one group and the other group will be randomly selected homes that are not close to the park and school. Find the property values for each home in both groups.
Question 11.
DRAWING CONCLUSIONS
A company wants to test whether a nutritional supplement has an adverse effect on an athlete’s heart rate while exercising. Identify a potential problem, if any, with each experimental design. Then describe how you can improve it.
a. The company randomly selects 250 athletes. Half of the athletes receive the supplement and their heart rates are monitored while they run on a treadmill. The other half of the athletes are given a placebo and their heart rates are monitored while they lift weights. The heart rates of the athletes who took the supplement significantly increased while exercising.
b. The company selects 1000 athletes. The athletes are divided into two groups based on age. Within each age group, the athletes are randomly assigned to receive the supplement or the placebo. The athletes’ heart rates are monitored while they run on a treadmill. There was no significant difference in the increases in heart rates between the two groups.
Answer:
Question 12.
DRAWING CONCLUSIONS
A researcher wants to test the effectiveness of reading novels on raising intelligence quotient (IQ) scores. Identify a potential problem, if any, with each experimental design. Then describe how you can improve it.
a. The researcher selects 500 adults and randomly divides them into two groups. One group reads novels daily and one group does not read novels. At the end of 1 year, each adult is evaluated and it is determined that neither group had an increase in IQ scores.
b. Fifty adults volunteer to spend time reading novels every day for 1 year. Fifty other adults volunteer to refrain from reading novels for 1 year. Each adult is evaluated and it is determined that the adults who read novels raised their IQ scores by 3 points more than the other group.

Answer:
a. No potential problem
b. Has a potential problem
Explanation:
a. Since a researcher selects 500 adults and randomly divides them into two groups. One group reads novels and the other doesn’t, we do not have a potential problem.
b. From the given, we can note that the groups are not similar. One group is formed by the people who volunteer to read a novel and the other one doesn’t. Also, there are other habits that increase IQ scores which may have one of the volunteers. Hence, groups must be formed randomly because in that way groups will be similar and then compare the IQ scores between the groups.
Question 13.
DRAWING CONCLUSIONS
A fitness company claims that its workout program will increase vertical jump heights in 6 weeks. To test the workout program, 10 athletes are divided into two groups. The double bar graph shows the results of the experiment. Identify the potential problems with the experimental design. Then describe how you can improve it.
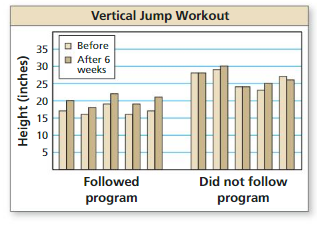
Answer:
Question 14.
WRITING
Explain why observational studies, rather than experiments, are usually used in astronomy.
Answer:
The universe is still unexplored and cannot be controlled by objects or generally, in most cases, we cannot create controlled conditions, so they rather use an observational study than experiments.
Question 15.
MAKING AN ARGUMENT
Your friend wants to determine whether the number of siblings has an effect on a student’s grades. Your friend claims to be able to show causality between the number of siblings and grades. Is your friend correct? Explain.
Answer:
Question 16.
HOW DO YOU SEE IT?
To test the effect political advertisements have on voter preferences, a researcher selects 400 potential voters and randomly divides them into two groups. The circle graphs show the results of the study.
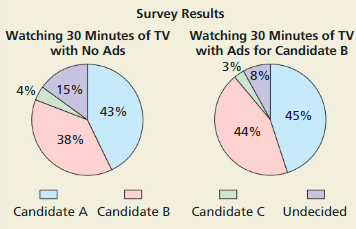
a. Is the study a randomized comparative experiment? Explain.
b. Describe the treatment.
c. Can you conclude that the political advertisements were effective? Explain.
Answer:
a. A randomized comparative experiment.
b. The treatment was the ads for Candidate B.
c. Not effective
Explanation:
a. Since the voters are randomly divided into two groups, none of the groups is formed based on bias and we have a control and treatment group, it is a randomized comparative treatment.
b. The treatment was the ads for Candidate B.
c. Since there are significantly fewer differences between the graphs, we can conclude that there is no important change for candidate B.
Question 17.
WRITING
Describe the placebo effect and how it affects the results of an experiment. Explain how a researcher can minimize the placebo effect.
Answer:
Question 18.
THOUGHT PROVOKING
Make a hypothesis about something that interests you. Design an experiment that could show that your hypothesis is probably true.
Answer:
Corn treated with the supplement is higher than corn that is not. By random selection, we form two groups with small corn plants. One group is treated with a supplement and the other is not. Keppal the other variables constant and compare the results after measure.
Question 19.
REASONING
Will replicating an experiment on many individuals produce data that are more likely to accurately represent a population than performing the experiment only once? Explain.
Answer:
Maintaining Mathematical Proficiency
Draw a dot plot that represents the data. Identify the shape of the distribution.
Question 20.
Ages: 24, 21, 22, 26, 22, 23, 25, 23, 23, 24, 20, 25
Answer:
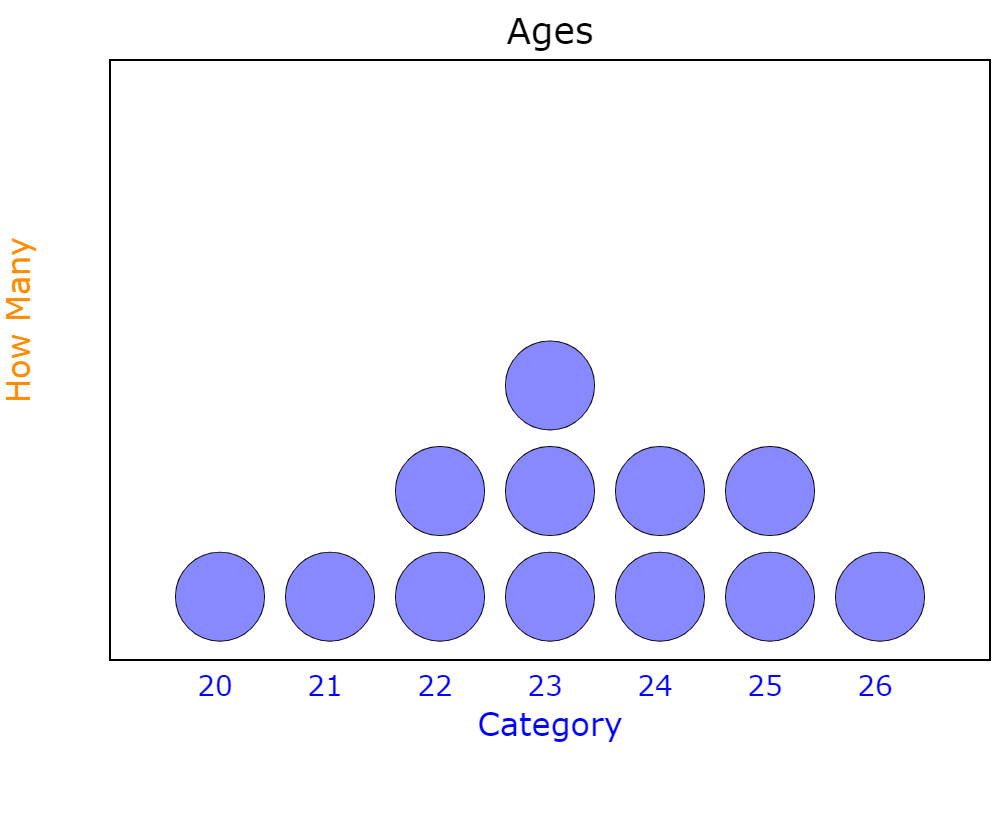
The shape of a distribution is symmetric.
Question 21.
Golf strokes: 4, 3, 4, 3, 3, 2, 7, 5, 3, 4
Answer:
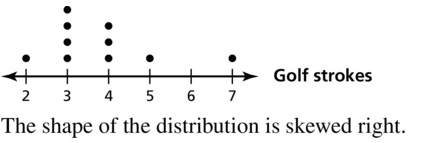
Tell whether the function represents exponential growth or exponential decay. Then graph the function.
Question 22.
y = 4x
Answer:
Identify the value of the base. The base 4 is greater than 1 so the function represents exponential growth. Now, let’s make a table of values
| x | -2 | -1 | 0 | 1 | 2 | 3 |
| y | 1/16 | 1/4 | 1 | 4 | 16 | 64 |
Plot the points from the table. Draw from left to right, a smooth curve that begins just above the x-axis, passes through the plotted points, and moves up to the right.
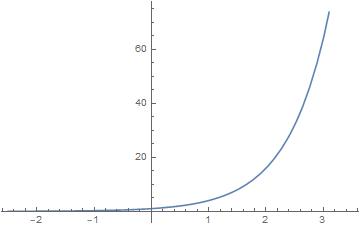
Question 23.
y = (0.95)x
Answer:
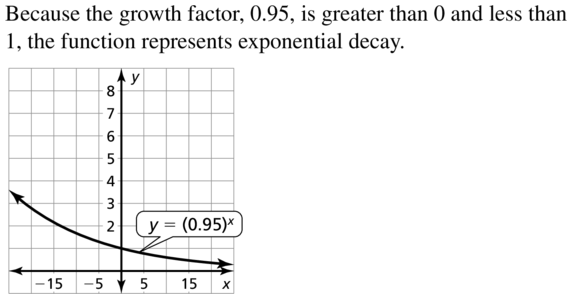
Question 24.
y = (0.2)x
Answer:
Identify the value of the base. The base 0.2 is less than 1 so the function represents exponential decay.
| x | -2 | -1 | 0 | 1 | 2 | 3 |
| y | 25 | 5 | 1 | 0.2 | 0.04 | 0.008 |
Plot the points from the table. Draw from right to left, a smooth curve that begins just above the x-axis, passes through the plotted points and moves up to the left.
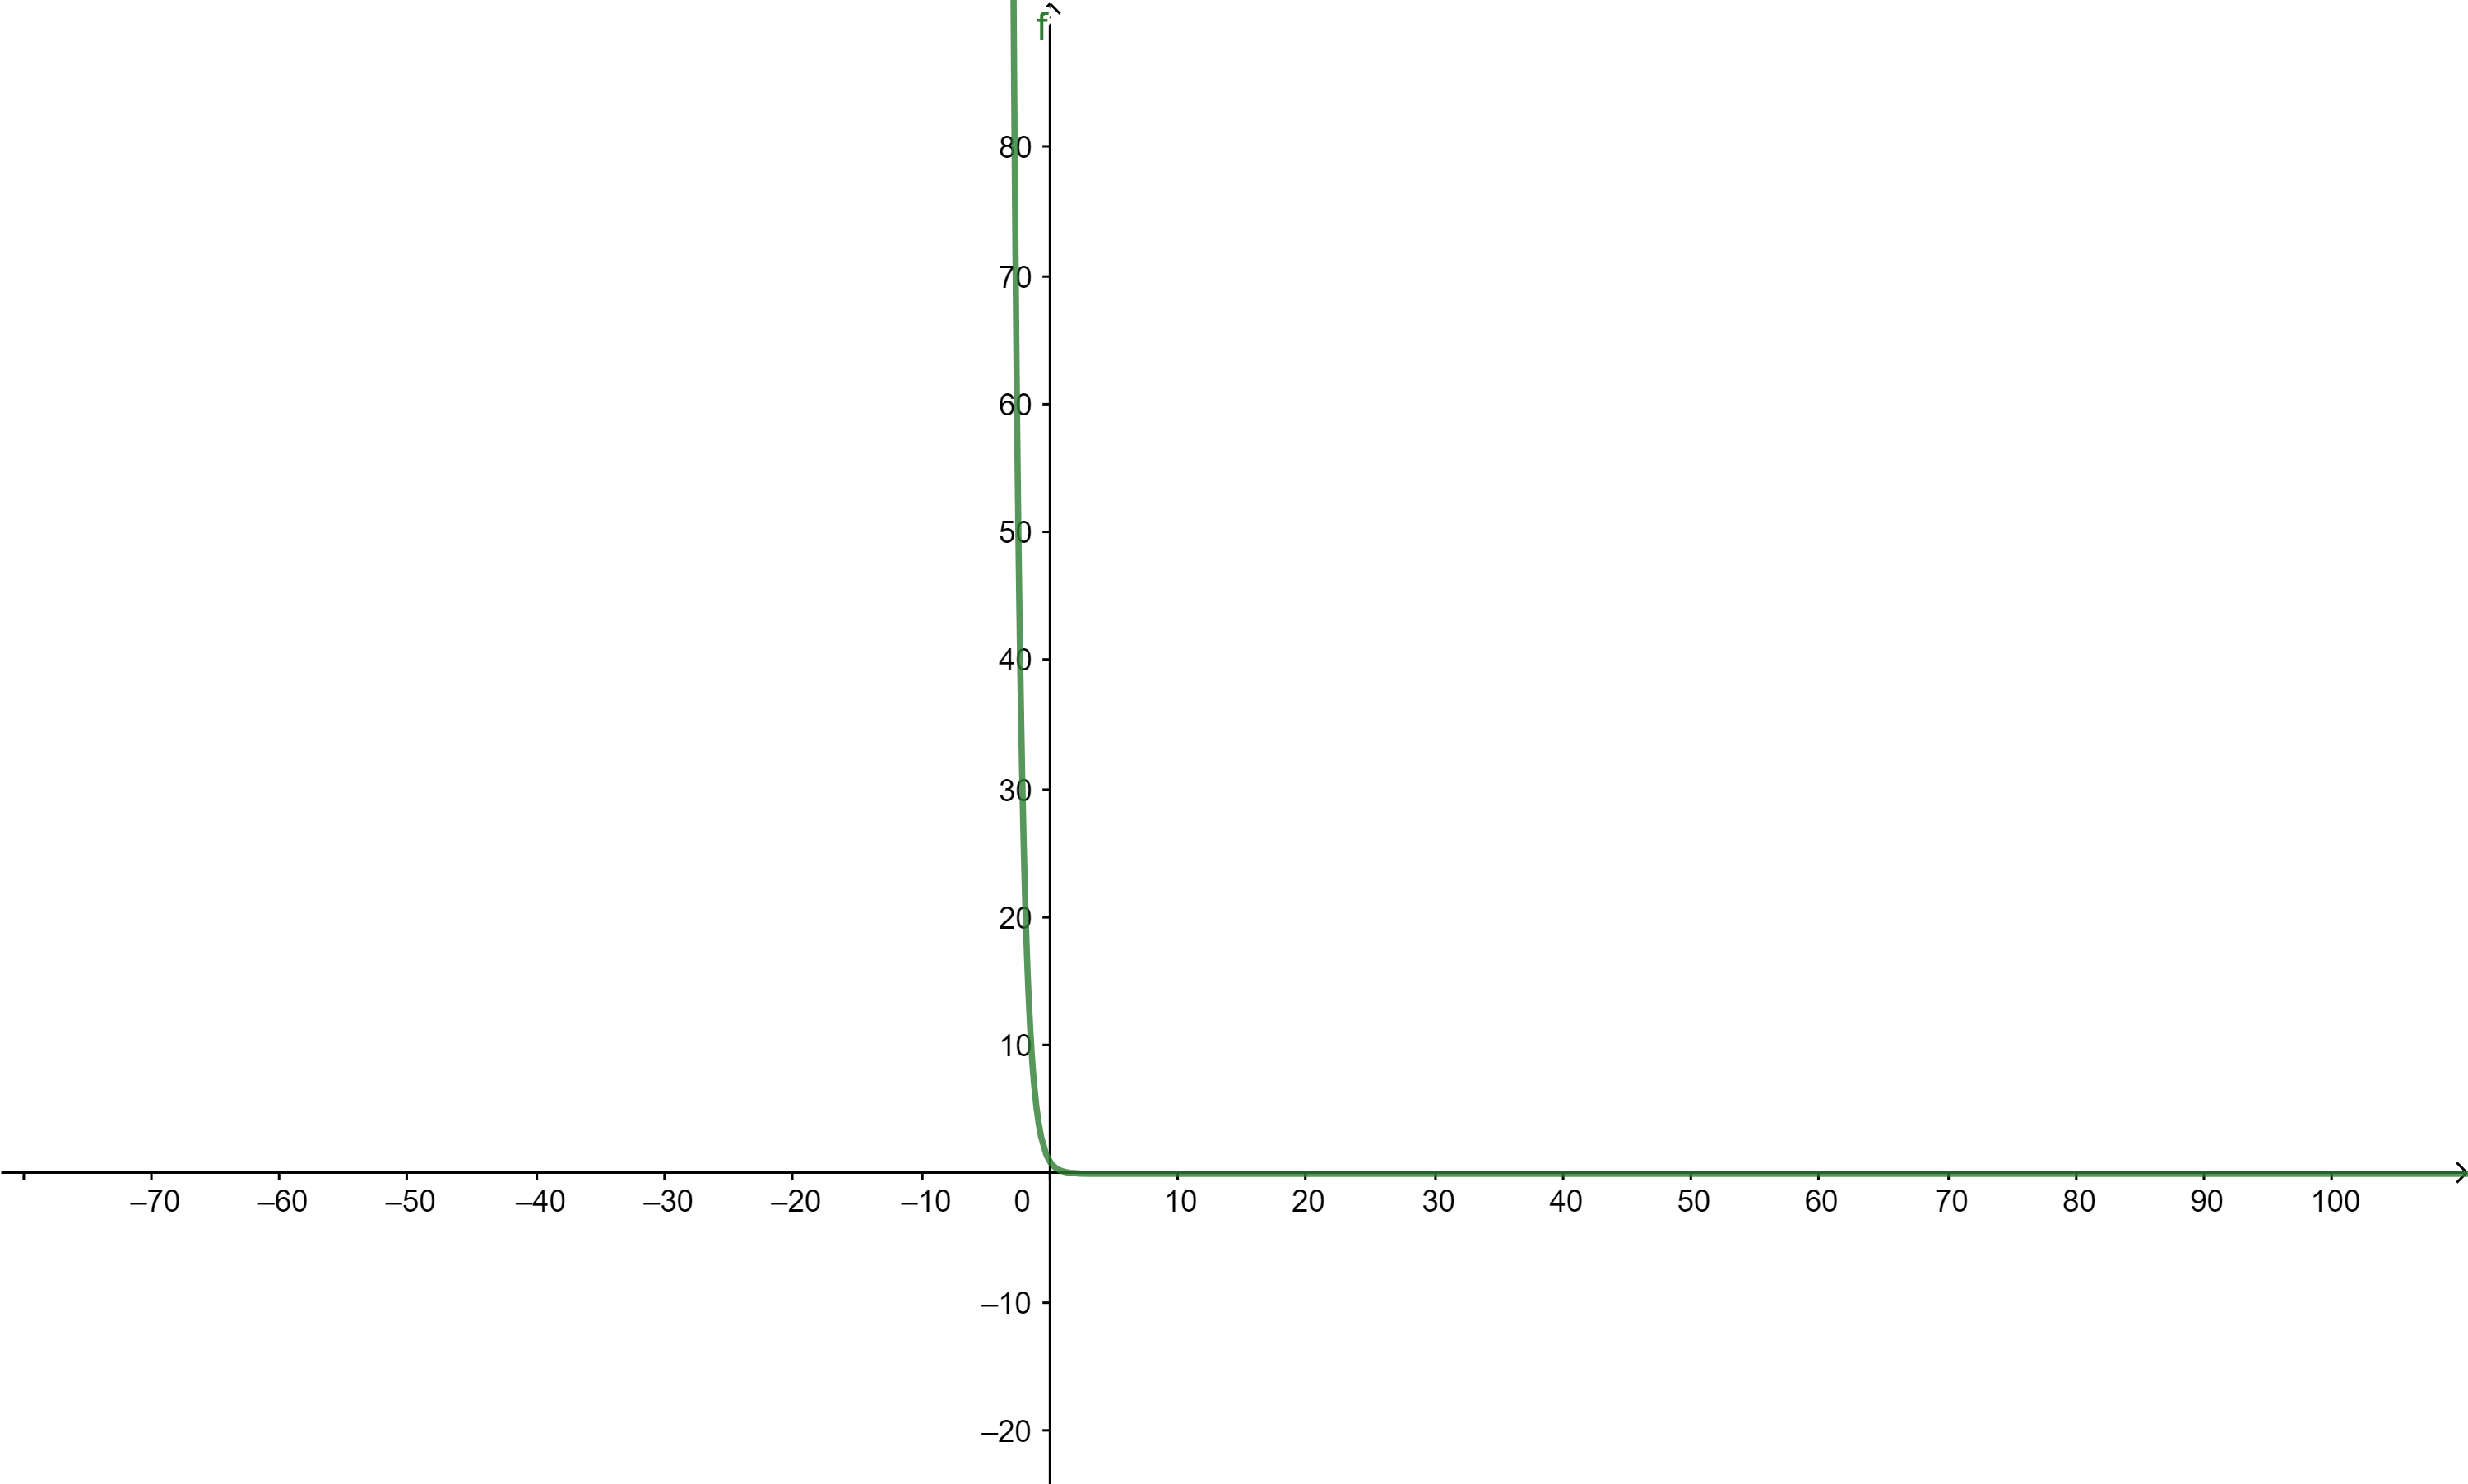
Question 25.
y = (1.25)x
Answer:
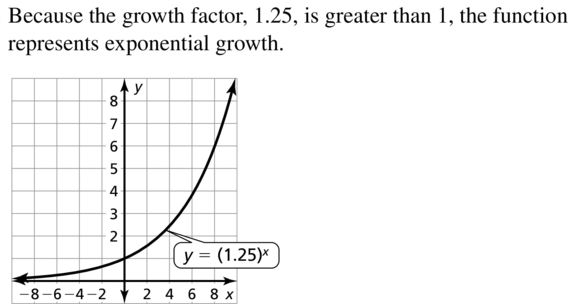
Lesson 11.5 Making Inferences from Sample Surveys
Essential Question How can you use a sample survey to infer a conclusion about a population?
EXPLORATION 1
Making an Inference from a Sample
Work with a partner. You conduct a study to determine what percent of the high school students in your city would prefer an upgraded model of their current cell phone. Based on your intuition and talking with a few acquaintances, you think that 50% of high school students would prefer an upgrade. You survey50 randomly chosen high school students and find that 20 of them prefer an upgraded model.
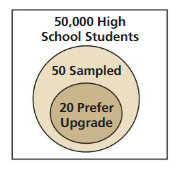
a. Based on your sample survey, what percent of the high school students in your city would prefer an upgraded model? Explain your reasoning.
b. In spite of your sample survey, is it still possible that 50% of the high school students in your city prefer an upgraded model? Explain your reasoning.
c. To investigate the likelihood that you could have selected a sample of 50 from a population in which 50% of the population does prefer an upgraded model, you create a binomial distribution as shown below. From the distribution, estimate the probability that exactly 20 students surveyed prefer an upgraded model. Is this event likely to occur? Explain your reasoning.
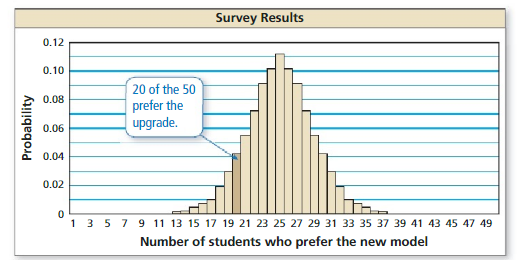
d. When making inferences from sample surveys, the sample must be random. In the situation described above, describe how you could design and conduct a survey using a random sample of 50 high school students who live in a large city.
Communicate Your Answer
Question 2.
How can you use a sample survey to infer a conclusion about a population?
Answer:
A population is a complete group of people or things. A sample is part of the population.
To make inferences or conclusions about the population, You can use the sample.
A complete set of possible cases.
A subset of the population from which data is collected.
Inference statistics is a process of using sample statistics to draw conclusions about population parameters.
In other words, the data from the sample is used to make inferences about the population.
Question 3.
In Exploration 1(c), what is the probability that exactly 25 students you survey prefer an upgraded model?
Answer:
Given,
There are 50,000 high school students
Sample = 50 high school students
The probability that exactly 25 students you survey prefer an upgraded model = 25/50 = 0.5
Thus the probability that exactly 25 students you survey prefer an upgraded model is 0.5
Monitoring Progress
Question 1.
The data from another random sample of 30 teen users of the social networking website are shown in the table. Estimate the population mean μ.
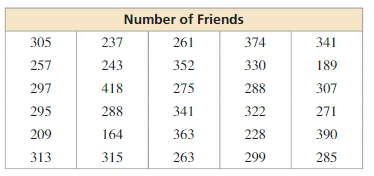
Answer:
μ = 294
Explanation:
To estimate the mean, we will sum all values from the table and then divide with the count of members that participate in the sum
μ = \(\frac { 1 }{ 30 } \)(305 + 237 + . . . + 287) = \(\frac { 1 }{ 30 } \) . 8820 = 294
Question 2.
Two candidates are running for class president. The table shows the results of four surveys of random students in the class. The students were asked whether they will vote for the incumbent. Do you think the incumbent will be reelected? Explain.
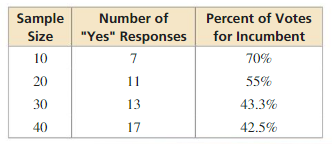
Answer:
The circumvent will not be rejected.
Explanation:
As a sample size increases, we can notice that percentage of the percent of voters for incumbents decreases. Thus, since for the sample size of 40, we see that support is less than 50%, we can conclude that the circumbent will not be rejected.
Question 3.
WHAT IF?
In Example 3, what can you conclude about the accuracy of the claim that the population proportion is 0.34 when 21 adults in your random sample say mathematics is the most valuable subject?
Answer:
The company claim is probably not accurate.
Explanation:
Note that 21 out of 50 corresponds to a sample proportion of \(\frac { 21 }{ 50 } \) = 0.42. In the simulation, this result occured in 5 of the 80 random samples. It is unlikely that 21 adults out of 50 would say math is the most valuable subject when the true population percentage is 34%. So, you can conclude the company claim is probably not accurate.
Question 4.
In a survey of 1028 people in the U.S., 87% reported using the Internet. Give an interval that is likely to contain the exact percent of all people in the U.S. who use the Internet.
Answer:
The interval between 83.9% to 90.1%
Explanation:
Since in the survey participiate n = 1028 people from the U.S, the marigin error will be
±\(\frac { 1 }{ √n } \) = ±\(\frac { 1 }{ √1028 } \) = ±0.031
Thus, the interval that is likely to contain the exact percent of all people in the U.S who use the internet will be
(87% – 31%, 87% – 31%) = (83.9%, 90.1%)
Thus, the interval between 83.9% to 90.1%
Making Inferences from Sample Surveys 11.5 Exercises
Vocabulary and Core Concept Check
Question 1.
COMPLETE THE SENTENCE
The ___________ gives a limit on how much the responses of the sample would differ from the responses of the population.
Answer:
Question 2.
WRITING
What is the difference between descriptive and inferential statistics?
Answer:
Descriptive statistics summarize the characteristics of a data set. Inferential statistics allow you to test a hypothesis or assess whether your data is generalizable to the broader population.
Monitoring Progress and Modeling with Mathematics
Question 3.
PROBLEM SOLVING
The numbers of text messages sent each day by a random sample of 30 teen cellphone users are shown in the table. Estimate the population mean μ.
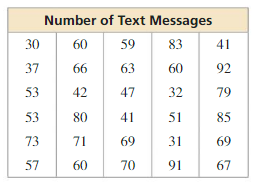
Answer:
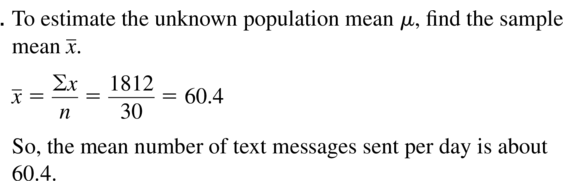
Question 4.
PROBLEM SOLVING
The incomes for a random sample of 35 U.S. households are shown in the table. Estimate the population mean μ.
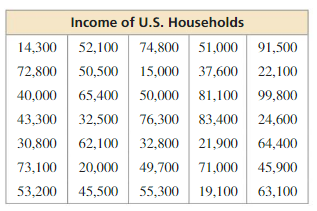
Answer:
μ = 51029
Explanation:
The mean will be estimated as a sum of elements from the table divided with the 5. Hence
μ = \(\frac { 1 }{ 35 } \)(14300 + 72800 + . . + 63100) = $51029
Question 5.
PROBLEM SOLVING
Use the data in Exercise 3 to answer each question.
a. Estimate the population proportion ρ of teen cellphone users who send more than 70 text messages each day.
b. Estimate the population proportion ρ of teen cellphone users who send fewer than 50 text messages each day.
Answer:
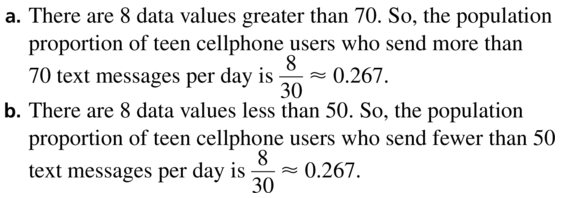
Question 6.
WRITING
A survey asks a random sample of U.S. teenagers how many hours of television they watch each night. The survey reveals that the sample mean is 3 hours per night. How condent are you that the average of all U.S. teenagers is exactly 3 hours per night? Explain your reasoning.

Answer:
Not at all confident
Explanation:
Not at all confident. Why? We have that the sample mean is 3 hours per night and we cannot expect that the average of all US teenagers is exactly 3 hours per night, maybe the result can be close to 3 but not exactly 3.
Question 7.
DRAWING CONCLUSIONS
When the President of the United States vetoes a bill, the Congress can override the veto by a two-thirds majority vote in each House. Five news organizations conduct individual random surveys of U.S. Senators. The senators are asked whether they will vote to override the veto. The results are shown in the table.
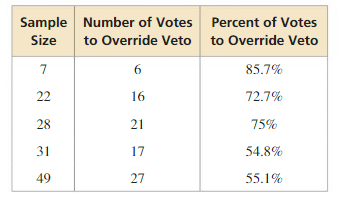
a. Based on the results of the first two surveys, do you think the Senate will vote to override the veto? Explain.
b. Based on the results in the table, do you think the Senate will vote to override the veto? Explain.
Answer:
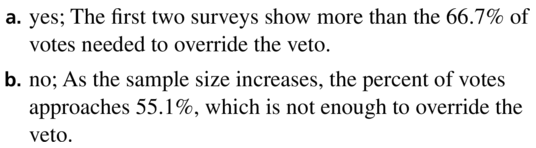
Question 8.
DRAWING CONCLUSIONS
Your teacher lets the students decide whether to have their test on Friday or Monday. The table shows the results from four surveys of randomly selected students in your grade who are taking the same class. The students are asked whether they want to have the test on Friday.
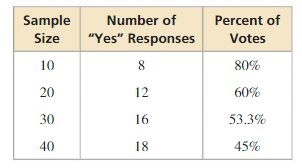
a. Based on the results of the first two surveys, do you think the test will be on Friday? Explain.
b. Based on the results in the table, do you think the test will be on Friday? Explain.
Answer:
a. Test will be in Friday
b. Test will be in Monday
Explanation:
a. Based on the results of the first two surveys, the test will be on friday because there we have more than half the majority.
b. From the table, as the sample size increases, the percentage of voters for test on Friday decreases, and in the last survey, we have 45% which is not enough.
Question 9.
MODELING WITH MATHEMATICS
A national polling company claims that 54% of U.S. adults are married. You survey a random sample of 50 adults.
a. What can you conclude about the accuracy of the claim that the population proportion is 0.54 when 31 adults in your survey are married?
b. What can you conclude about the accuracy of the claim that the population proportion is 0.54 when 19 adults in your survey are married?
c. Assume that the true population proportion is 0.54. Estimate the variation among sample proportions for samples of size 50.
Answer:
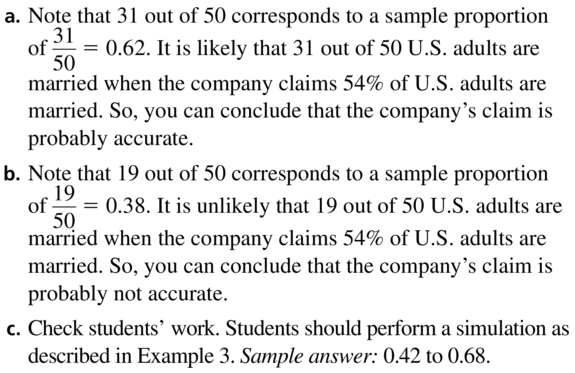
Question 10.
MODELING WITH MATHEMATICS
Employee engagement is the level of commitment and involvement an employee has toward the company and its values. A national polling company claims that only 29% of U.S. employees feel engaged at work. You survey a random sample of 50 U.S. employees.
a. What can you conclude about the accuracy of the claim that the population proportion is 0.29 when 16 employees feel engaged at work?
b. What can you conclude about the accuracy of the claim that the population proportion is 0.29 when 23 employees feel engaged at work?
c. Assume that the true population proportion is 0.29. Estimate the variation among sample proportions for samples of size 50.
Answer:
a. The company’s claim is probably correct
b. The company’s claim is probably incorrect
c. 0.15 to 0.43
In Exercises 11–16, find the margin of error for a survey that has the given sample size. Round your answer to the nearest tenth of a percent.
Question 11.
260
Answer:
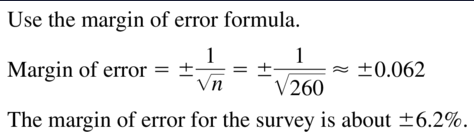
Question 12.
1000
Answer:
The margin of error = ±\(\frac { 1 }{ n } \) = ±\(\frac { 1 }{ √1000 } \) = ±0.031
The margin of error for the survey is about ±3.1%.
Question 13.
2024
Answer:
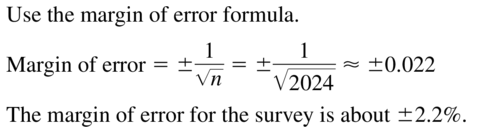
Question 14.
6400
Answer:
The margin of error = ±\(\frac { 1 }{ n } \) = ±\(\frac { 1 }{√6400 } \) = ±0.0125
The margin of error for the survey is about ±1.25%.
Question 15.
3275
Answer:
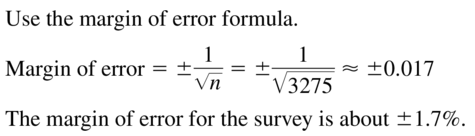
Question 16.
750
Answer:
The margin of error = ±\(\frac { 1 }{ n } \) = ±\(\frac { 1 }{√750} \) = ±0.036
The margin of error for the survey is about ±3.6%
Question 17.
ATTENDING TO PRECISION
In a survey of 1020 U.S. adults, 41% said that their top priority for saving is retirement.
a. What is the margin of error for the survey?
b. Give an interval that is likely to contain the exact percent of all U.S. adults whose top priority for saving is retirement.
Answer:
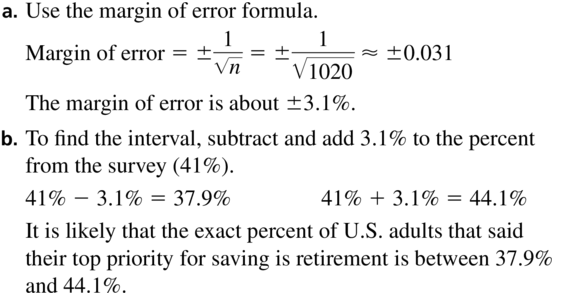
Question 18.
ATTENDING TO PRECISION
In a survey of 1022 U.S. adults, 76% said that more emphasis should be placed on producing domestic energy from solar power.

a. What is the margin of error for the survey?
b. Give an interval that is likely to contain the exact percent of all U.S. adults who think more emphasis should be placed on producing domestic energy from solar power.
Answer:
a. The margin error for the survey is about ±3.1%
b. Between 72.9% and 79.1%
Explanation:
a. The margin error of the sample size n = 1020 will be ±\(\frac { 1 }{ √n } \) = ±\(\frac { 1 }{ √1020 } \) = 0.031
The margin error for the survey is about ±3.1%
b. To find the interval, subtract and add 3.1% to the percent of people surveyed who said that more emphasis should be placed on producing domestic energy from solar power (76%)
76% – 3.1% = 72.9%
76% + 3.1% = 79.1%
It is likely that the exact percent of all people in the U.S who said that is likely to contain the exact percent of all U.S adults whose top priority for saving is retirement is between 72.9% and 79.1%
Question 19.
ERROR ANALYSIS
In a survey, 8% of adult Internet users said they participate in sports fantasy leagues online. The margin of error is ±4%. Describe and correct the error in calculating the sample size.
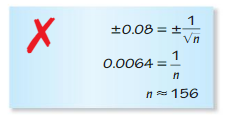
Answer:
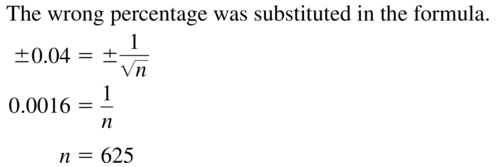
Question 20.
ERROR ANALYSIS
In a random sample of 2500 consumers, 61% prefer Game A over Game B. Describe and correct the error in giving an interval that is likely to contain the exact percent of all consumers who prefer Game A over Game B.

Answer:
To find, the interval subtract and add margin error to the percent of people surveyed who prefer Game A over Game B (61%). Thus since the margin error is 2%, the interval is 61% – 2% = 59%
61% + 2% = 63%
hence, it is likely that the exact percent of all consumers who prefer Game A over Game B is between 59% and 63%.
Question 21.
MAKING AN ARGUMENT
Your friend states that it is possible to have a margin of error between 0 and 100 percent, not including 0 or 100 percent. Is your friend correct? Explain your reasoning.
Answer:

Question 22.
HOW DO YOU SEE IT?
The figure shows the distribution of the sample proportions from three simulations using different sample sizes. Which simulation has the least margin of error? the greatest? Explain your reasoning.
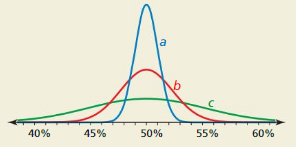
Answer:
The least margin of error has simulation a. The greatest margin of error has simulation c.
Explanation:
The margin error is proportional to the standard deviation. Thus, from the graph, we can conclude that simulation a has the least standard deviation which implies a has the least marginal error. The greatest standard deviation has simulation c which implies that simulation c has the greatest marginal error.
Question 23.
REASONING
A developer claims that the percent of city residents who favor building a new football stadium is likely between 52.3% and 61.7%. How many residents were surveyed?

Answer:
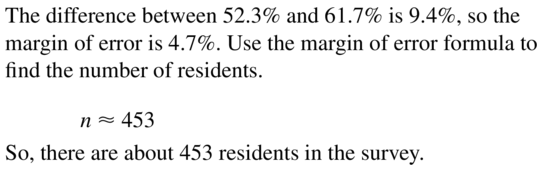
Question 24.
ABSTRACT REASONING
Suppose a random sample of size n is required to produce a margin of error of ±E. Write an expression in terms of n for the sample size needed to reduce the margin of error to ±1—2E. How many times must the sample size be increased to cut the margin of error in half? Explain.
Answer:
The sample must be four times greater than the size of the sample n with the margin error E.
Explanation:
E = ±\(\frac { 1 }{ √n } \)
To compute how many times must the sample size be increased to cut the margin of error in half let’s set the following
\(\frac { 1 }{ 2 } \)E = ±\(\frac { 1 }{ √x } \)
\(\frac { 1 }{ 2 } \) . (±\(\frac { 1 }{ √n } \)) = ±\(\frac { 1 }{ √x } \)
(±\(\frac { 1 }{ 2√n } \))² = (±\(\frac { 1 }{ √x } \))²
\(\frac { 1 }{ 4n } \) = \(\frac { 1 }{ x } \)
x = 4n
The sample must be four times greater than the size of the sample n with the margin error E.
Question 25.
PROBLEM SOLVING
A survey reported that 47% of the voters surveyed, or about 235 voters, said they voted for Candidate A and the remainder said they voted for Candidate B.
a. How many voters were surveyed?
b. What is the margin of error for the survey?
c. For each candidate, find an interval that is likely to contain the exact percent of all voters who voted for the candidate.
d. Based on your intervals in part (c), can you be confident that Candidate B won? If not, how many people in the sample would need to vote for Candidate B for you to be condent that Candidate B won? (Hint: Find the least number of voters for Candidate B so that the intervals do not overlap.)
Answer:
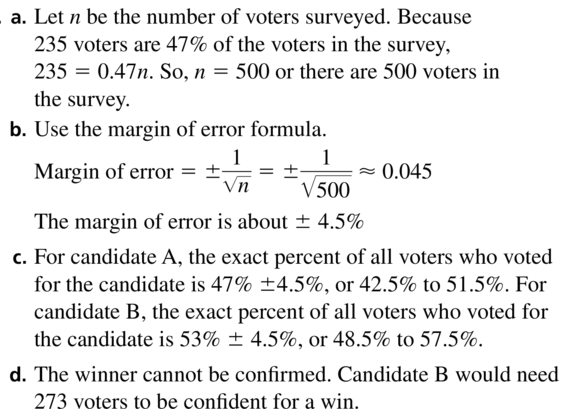
Question 26.
THOUGHT PROVOKING
Consider a large population in which ρ percent (in decimal form) have a certain characteristic. To be reasonably sure that you are choosing a sample that is representative of a population, you should choose a random sample of n people where n > 9\(\left(\frac{1-\rho}{\rho}\right)\) .
a. Suppose ρ= 0.5. How large does n need to be?
b. Suppose ρ= 0.01. How large does n need to be?
c. What can you conclude from parts (a) and (b)?
Answer:
a. n > 9
b. n > 981
c. The smaller percentage of people with a certain characteristic, the larger the sample size is necessary for appropriate representation of the population.
Explanation:
a. If proportion population is p = 0.5, let’s compute the size of the population
n > 9(\(\frac { 1 – p }{ p } \)
For p = 0.5
n > 9(\(\frac { 1 – 0.5 }{ 0.5 } \)
n > 9(0.5/0.5)
n > 9
b. If proportion population p = 0.01
n > 9(\(\frac { 1 – 0.01 }{ 0.01 } \)
n > 9 . (\(\frac { 0.99 }{ 0.01 } \))
n > 9 . 99
n > 891
c. From parts a and b, you can conclude that the smaller percentage of people with a certain characteristic, the larger the sample size is necessary for appropriate representation of the population.
Question 27.
CRITICAL THINKING
In a survey, 52% of the respondents said they prefer sports drink X and 48% said they prefer sports drink Y. How many people would have to be surveyed for you to be confident that sports drink X is truly preferred by more than half the population? Explain.
Answer:
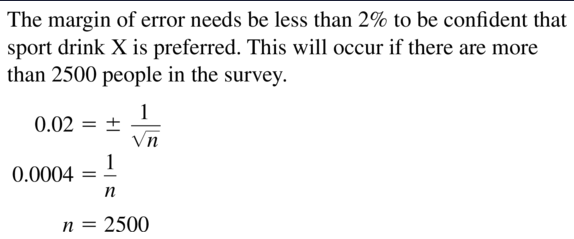
Maintaining Mathematical Proficiency
Find the inverse of the function.
Question 28.
y= 10x-3
Answer:
The inverse of the function is y = logx + 3
Explanation:
y= 10x-3
To find the inverse function, interchange x and y
x = 10y-3
logx = log10y-3
logx = y – 3
y = logx + 3
Question 29.
y= 2x – 5
Answer:

Question 30.
y= ln (x+ 5)
Answer:
The inverse of the function is y = ex – 5
Explanation:
y= ln (x+ 5)
To find the inverse function, interchange x and y
x = ln(y + 5)
ex = eln(y+5)
ex = y + 5
y = ex – 5
Question 31.
y= log6x− 1
Answer:
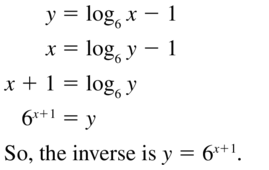
Determine whether the graph represents an arithmetic sequence or a geometric sequence. Then write a rule for the nth term.
Question 32.
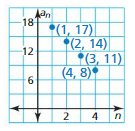
Answer:
The arithmetic sequence an = 20 – 3n
Explanation:
From the graph, we have the following points (1, 17), (2, 14), (3, 11), (4, 8)
Now, let’s denote the following participants of the sequence
a1 = 17
a2 = 14
a3 = 11
a4 = 8
Now, to decide to do is an arithmetic or geometric sequence, let’s consider the following terms
d = a<n-1> – a<n-2> = a<k-1> – a<k-2>
q = \(\frac { a<n> }{ a<n-1> } \) = \(\frac { a<k> }{ a<k-1> } \)
a2 – a1 = a3 – a2 = a3 – a4 = -3
a<n> = a<1> + (n – 1)d
Hence, by using the formula, the form of sequence is a<n> = 17 + (n – 1)(-3)
= 17 – 3n + 3
= 20 – 3n
Question 33.
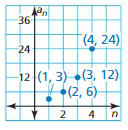
Answer:
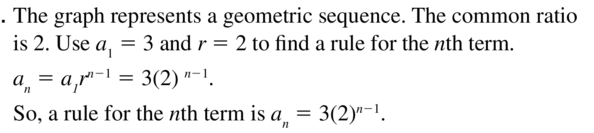
Question 34.
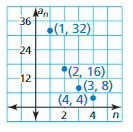
Answer:
A geometric sequence form of a<n> = 24 . \(\frac { 1 }{ 2^(n-1) } \)
Explanation:
From the graph, we have the following points (1, 32), (2, 16), (3, 8), (4, 4)
Now, let’s denote the following participants of the sequence
a1 = 32
a2 = 16
a3 = 8
a4 = 4
Now, to decide to do is an arithmetic or geometric sequence, let’s consider the following terms
d = a<n-1> – a<n-2> = a<k-1> – a<k-2>
r = \(\frac { an }{ a(n – 1) } \)
\(\frac { a2 }{ a1 } \) = \(\frac { 1 }{ 2 } \)
a<n> = a1 . r^(n-1)
Hence, by using the formula, the form of sequence is a<n> = 24 . (\(\frac { 1 }{ 2 } \))^(n-1)
= 24 . \(\frac { 1 }{ 2^(n-1) } \)
Lesson 11.6 Making Inferences from Experiments
Essential Question How can you test a hypothesis about an experiment?
EXPLORATION 1
Resampling Data
Work with a partner. A randomized comparative experiment tests whether water with dissolved calcium affects the yields of yellow squash plants. The table shows the results.
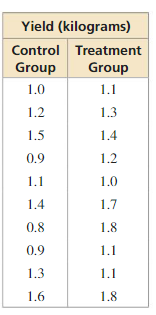
a. Find the mean yield of the control group and the mean yield of the treatment group. Then find the difference of the two means. Record the results.
b. Write each yield measurement from the table on an equal-sized piece of paper. Place the pieces of paper in a bag, shake, and randomly choose 10 pieces of paper. Call this the “control” group, and call the 10 pieces in the bag the “treatment” group. Then repeat part (a) and return the pieces to the bag. Perform this resampling experiment five times.
c. How does the difference in the means of the control and treatment groups compare with the differences resulting from chance?
EXPLORATION 2
Evaluating Results
Work as a class. To conclude that the treatment is responsible for the difference in yield, you need strong evidence to reject the hypothesis:
Water dissolved in calcium has no effect on the yields of yellow squash plants.
To evaluate this hypothesis, compare the experimental difference of means with the resampling differences.
a. Collect all the resampling differences of means found in Exploration 1(b) for the whole class and display these values in a histogram.
b. Draw a vertical line on your class histogram to represent the experimental difference of means found in Exploration 1(a).
c. Where on the histogram should the experimental difference of means lie to give evidence for rejecting the hypothesis?
d. Is your class able to reject the hypothesis? Explain your reasoning.
Communicate Your Answer
Question 3.
How can you test a hypothesis about an experiment?
Answer:
There are 5 steps for testing.
1. Select your research hypothesis as a null hypothesis and alternate hypothesis.
2. Collect the data designed to test the hypothesis.
3. Next perform an appropriate statistical test.
4. Describe whether to reject your null hypothesis.
5. Write the findings in your results and discussion section.
Question 4.
The randomized comparative experiment described in Exploration 1 is replicated and the results are shown in the table. Repeat Explorations 1 and 2 using this data set. Explain any differences in your answers.
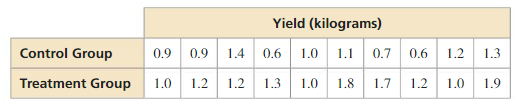
Answer:
Monitoring Progress
Question 1.
In Example 1, interpret the meaning of \(\bar{x}_{\text {treatment }}\) \(\bar{x}_{\text {control }}\) control when the difference is (a) negative, (b) zero, and (c) positive.
Answer:
a. Positive means the treatment (soil supplement) increases the total yield (in kilograms) of cherry tomato plants.
b. Negative means the treatment (soil supplement) decreases the total yield (in kilograms) of cherry tomato plants.
c. Zero means the treatment made no difference.
Question 2.
In Example 3, what are the consequences of concluding that the hypothesis is false when it is actually true?
Answer:
a. 46
b. 35.13
d. double dot plot of the data
e. We can conclude that music therapy may be effective to college students with depression.
Explanation:
a. The mean score of the control group = \(\frac { 49 + 45 + 43 + 47 + 46 + 45 + 47 + 46 }{ 8 } \)
= \(\frac { 368 }{ 8 } \)
= 46
b. The mean score of the treatment group = \(\frac { 39 + 40 + 39 + 37 + 41 + 40 + 42 + 43 }{ 8 } \)
= \(\frac { 281 }{ 8 } \)
= 35.13
c. The experimental difference of the means = 35.13 – 46
= -10.87
d. The double data plot of the data is
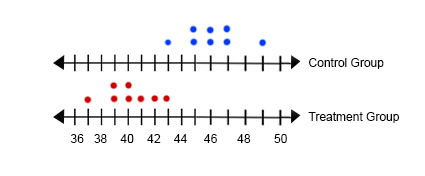
e. The data shows that the treatment groups shows lowest scores compared to the control group. We can conclude that music therapy may be effective to college students with depression.
Making Inferences from Experiments 11.6 Exercises
Vocabulary and Core Concept Check
Question 1.
COMPLETE THE SENTENCE
A method in which new samples are repeatedly drawn from the data set is called ____________.
Answer:
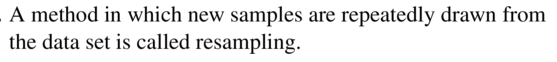
Question 2.
DIFFERENT WORDS, SAME QUESTION
Which is different? Find “both” answers.
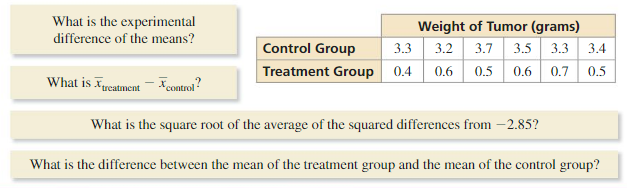
Answer:
What is the square root of the average of the squared differences from 2.85. The same answer is -2.85, different answer is 5.03.
Explanation:
The experimental difference of the means between the averages of the experimental (treatment) group and control groups, which can be written as μ<treatment> – μ<control>
So, the different question is the third question which asks to determine the square root of the average of the sqaured differences from 2.85.
μ<treatment> = \(\frac { 1 }{ 6 } \)(0.4 + 0.6 + 0.5 + 0.6 + 0.7+ 0.5)
= 0.55
μ<control> = \(\frac { 1 }{ 6 } \)(3.3 + 3.2 + 3.7 + 3.5 + 3.3 + 3.4) = 3.4
μ<treatment> – μ<control> = 0.55 – 3.4 = -2.85
The same answer is -2.85
the answer to the different question is
= √(\(\frac { 1 }{ 12 } \)((3.3 – (-2.85))² + (3.2 – (-2.85))² + . . . +(0.5 – (-2.85))²))
= √(\(\frac { 1 }{ 12 } \)(303.95))
= √(25.32)
= 5.03
Monitoring Progress and Modeling with Mathematics
Question 3.
PROBLEM SOLVING
A randomized comparative experiment tests whether music therapy affects the depression scores of college students. The depression scores range from 20 to 80, with scores greater than 50 being associated with depression. The control group has eight students and the treatment group, which receives the music therapy, has eight students. The table shows the results.
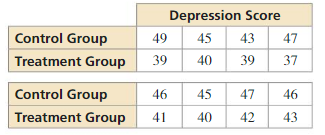
a. Find the mean score of the control group.
b. Find the mean score of the treatment group.
c. Find the experimental difference of the means.
d. Display the data in a double dot plot.
e. What can you conclude?

Answer:
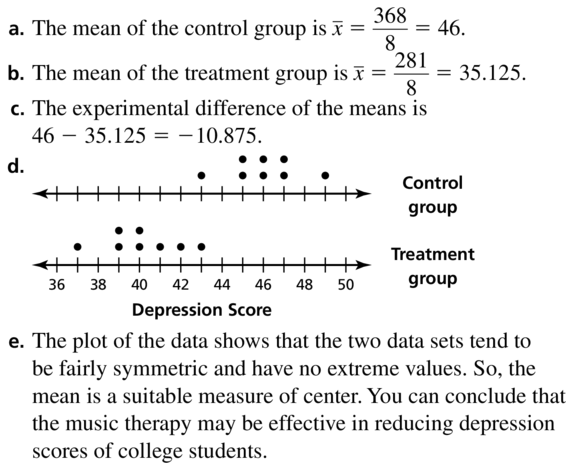
Question 4.
PROBLEM SOLVING
A randomized comparative experiment tests whether low-level laser therapy affects the waist circumference of adults. The control group has eight adults and the treatment group, which receives the low-level laser therapy, has eight adults. The table shows the results.
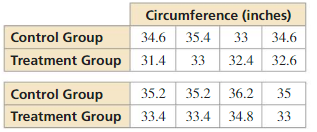
a. Find the mean circumference of the control group.
b. Find the mean circumference of the treatment group.
c. Find the experimental difference of the means.
d. Display the data in a double dot plot.
e. What can you conclude?
Answer:
a. 34.9
b. 33
c. -1.9
d. dot plots
e. We can conclude that low-level laser therapy has little effect in reducing waist circumference in adults.
Explanation:
a. By using the given data, let’s find the mean circumference of the control group.
μ<control> = \(\frac { 1 }{ 8 } \)(34.6 + 35.4 + 33 + 34.6 + 35.2 + 35.2 + 36.2 + 35) = \(\frac { 1 }{ 8 } \)(279.2) = 34.9
b. The mean of the treatment group
μ<treatment> = \(\frac { 1 }{ 8 } \)(31.4 + 33 + 32.4 + 32.6 + 33.4 + 33.4 + 33) = \(\frac { 1 }{ 8 } \)(264) = 33
c. The experimental maen is
μ<treatment> – μ<control> = 33 – 34.9 = -1.9
d. The dot plot of the control and treatment groups
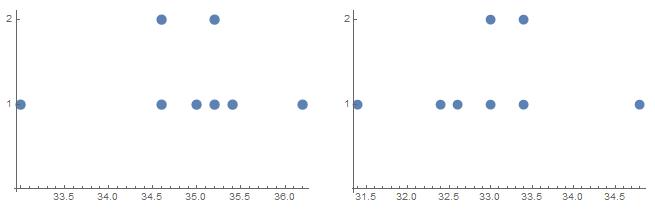
e. We can conclude that low-level laser therapy has little effect in reducing waist circumference in adults.
Question 5.
ERROR ANALYSIS
In a randomized comparative experiment, the mean score of the treatment group is 11 and the mean score of the control group is 16. Describe and correct the error in interpreting the experimental difference of the means.
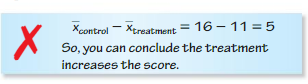
Answer:
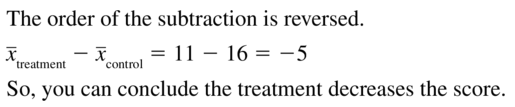
Question 6.
REASONING
In Exercise 4, interpret the meaning of \(\bar{x}_{\text {treatment }}-\bar{x}_{\text {control }}\) when the difference is positive, negative, and zero.
Answer:
Positive = treatment made waist bigger
Negative = treatment made waist smaller
Zero = no difference
Explanation:
The mean waist circumference of the treatment group is greater than the mean waist circumference of the control group.
Positive means the treatment made the waist circumference larger.
The mean waist circumference of the treatment group is less than the mean waist circumference of the control group.
Negative means the treatment made the waist circumference smaller.
The mean waist circumference of the treatment group is the same as the mean waist circumference of the control group.
Zero means the treatment made no difference.
Question 7.
MODELING WITH MATHEMATICS
Resample the data in Exercise 3 using a simulation. Use the means of the new control and treatment groups to calculate the difference of the means.
Answer:
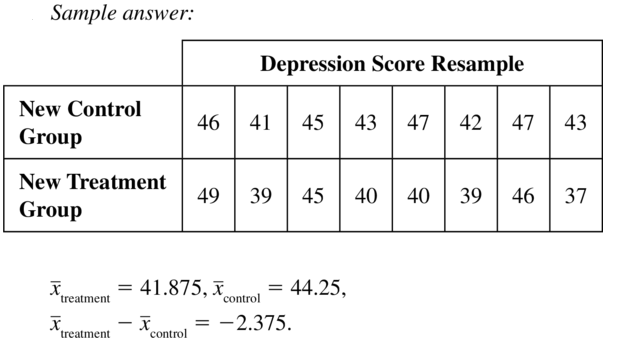
Question 8.
MODELING WITH MATHEMATICS
Resample the data in Exercise 4 using a simulation. Use the means of the new control and treatment groups to calculate the difference of the means.
Answer:
μ<new control> = 34.4
μ<new treatment> = 33.6
μ<new treatment> – μ<new control> = -0.8
Explanation:
First, combine the measurements from both groups and assign a number to each value. Let the numbers 1 through 8 represent the data in the original control group, and let the numbers 9 through 16 represent the data in the original treatment group
| Original control group | 34.6 | 35.4 | 33 | 34.6 | 35.2 | 35.2 | 36.2 | 35 |
| assigned number | 1 | 2 | 3 | 4 | 5 | 6 | 7 | 8 |
| Original treatment group | 31.4 | 33 | 32.4 | 32.6 | 33.4 | 33.4 | 33.8 | 33 |
| assigned number | 9 | 10 | 11 | 12 | 13 | 14 | 15 | 16 |
Use a random generator. Randomly generate 16 numbers from 1 through 16 without repeating a number.
| 8 | 5 | 15 | 7 | 12 | 1 | 13 | 3 |
| 14 | 4 | 16 | 9 | 11 | 10 | 2 | 6 |
Use the first 8 numbers to make the new control group, and the next 8 to make the new treatment group.
| New control group | 35 | 35.2 | 34.8 | 36.2 | 32.6 | 34.6 | 33.4 | 33 |
| New treatment group | 33.4 | 34.6 | 33 | 31.4 | 32.4 | 33 | 35.4 | 35.2 |
Mean of the new control and new treatment groups are
μ<new control> = \(\frac { 1 }{ 8 } \)(35 + 35.2 + 34.8 + 36.2 + 32.6 + 34.6 + 33.4 + 33)
= 34.4
μ<new treatment> = \(\frac { 1 }{ 8 } \)(33.4 + 34.6 + 33 + 31.4 + 32.4 + 33 + 35.4 + 35.2)
= 33.6
The experimental difference = μ<new treatment> – μ<new control> = 33.6 – 34.4 = -0.8
This is greater than the experimental difference found in example 4.
Question 9.
DRAWING CONCLUSIONS
To analyze the hypothesis below, use the histogram which shows the results from 200 resamplings of the data in Exercise 3.
Music therapy has no effect on the depression score.
Compare the experimental difference in Exercise 3 with the resampling differences. What can you conclude about the hypothesis? Does music therapy have an effect on the depression score?
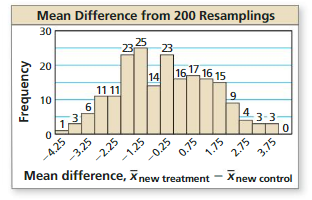
Answer:
Question 10.
DRAWING CONCLUSIONS
Suppose the experimental difference of the means in Exercise 3 had been −0.75. Compare this experimental difference of means with the resampling differences in the histogram in Exercise 9. What can you conclude about the hypothesis? Does music therapy have an effect on the depression score?
Answer:
You can conclude that the hypothesis is most likely true. So, music therapy has no effect on depression scores.
Explanation:
The histogram shows the results of the simulation. The histogram is approximately bell shaped and fairly symmetric, so the differences have an approximate normal distribution. Note that the hypothesis assumes that the difference of the mean yields iis 0. The experimental difference of -0.75, however lies close to the left tail.
From the graph, there are about 106 to 113 values out of 200 that are greater than -0.75 which is more than 50% of the values. Also, the experimental difference falls inside the middle 90% of the resampling differences. It is likely to get a difference this large when you assume that the difference is 0, suggesting the control group and the treatment group are not different.
You can conclude that the hypothesis is most likely true. So, music therapy has no effect on depression scores.
Question 11.
WRITING
Compare the histogram in Exercise 9 to the histogram below. Determine which one provides stronger evidence against the hypothesis, Music therapy has no effect on the depression score. Explain.
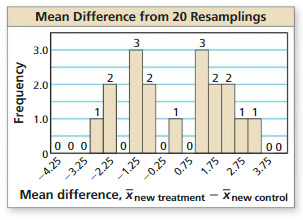
Answer:
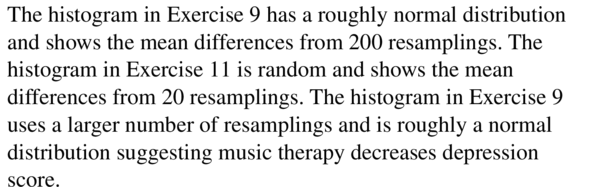
Question 12.
HOW DO YOU SEE IT?
Without calculating, determine whether the experimental difference, \(\bar{x}_{\text {treatment }}-\bar{x}_{\text {control }}\), is positive, negative, or zero. What can you conclude about the effect of the treatment? Explain.
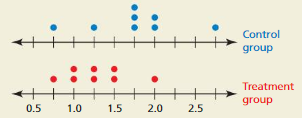
Answer:
The experimental difference is negative.
Explanation:
Most of the control values are greater than the treatment values which implies that the mean of the control group values will be greater than the mean of the treatment group values. The experimental difference is μ<treatment> – μ<control>
The experimental difference is negative. Also, by using the given graph, since the difference between the control values are treatment values is little, we can conclude that we have a slight effect.
Question 13.
MAKING AN ARGUMENT
Your friend states that the mean of the resampling differences of the means should be close to 0 as the number of resamplings increase. Is your friend correct? Explain your reasoning.
Answer:
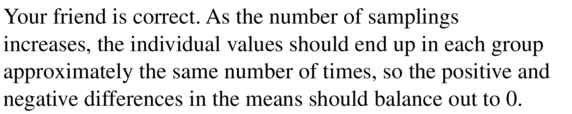
Question 14.
THOUGHT PROVOKING
Describe an example of an observation that can be made from an experiment. Then give four possible inferences that could be made from the observation.
Answer:
Let’s consider the mean increase in the growth of a hair given by using hair growth shampoo. Consider the 4 possible inferences:
1. The hair growth shampoo has no effect on the growth of hair.
2. The hair growth shampoo causes decreases in the growth of hair.
3. The hair growth shampoo causes a slight increase in the growth of hair
4. The hair growth shampoo causes a significant increase in the growth of hair.
Question 15.
CRITICAL THINKING
In Exercise 4, how many resamplings of the treatment and control groups are theoretically possible? Explain.
Answer:
Maintaining Mathematical Proficiency
Factor the polynomial completely.
Question 16.
5x3 − 15x2
Answer:
5x3 − 15x2 = 5x²(x – 3)
Explanation:
5x3 − 15x2 = 5. x² . x – 5. x² . 3
= 5x²(x – 3)
Question 17.
y3 − 8
Answer:
![]()
Question 18.
z3 + 5z2 − 9z − 45
Answer:
z3 + 5z2 − 9z − 45 = (z+3)(z – 3)(z + 5)
Explanation:
z3 + 5z2 − 9z − 45 = z³ + 5z² – 9z – 45 + 6z – 6z
= z³ + 5z² + 6z – 15z – 45
= z(z² + 5z + 6) – 15(z + 3)
z² + 5z + 6 = 0
Using the quadratic formula
z₁,₂ = \(\frac { -5 ± √(25 – 4 . 6)}{ 2 . 1 } \)
= \(\frac { -5 ± √(25 – 24)}{ 2} \)
= \(\frac { -5 ± 1}{ 2 } \)
The solutions are \(\frac { -5 + 1 }{ 2 } \) = -2, \(\frac { -5 – 1 }{ 2 } \) = -3
The fcators are
z² + 5z + 6 = (z + 2)(z + 3)
z3 + 5z2 − 9z − 45 = z(z² + 5z + 6) – 15(z + 3)
= z(z + 2)(z + 3) – 15(z + 3)
= (z +3)(z² + 2z – 15)
z² + 2z – 15 = 0
Using the quadratic formula
z₁,₂ = \(\frac { -2 ± √(4 – 4 . (-15))}{ 2 . 1 } \)
= \(\frac { -2 ± √(4 + 60)}{ 2 } \)
= \(\frac { -2 ± 8}{ 2} \)
Thus, the solutions are \(\frac { -2 + 8}{ 2} \) = 3, \(\frac { -2 – 8}{ 2} \) = -5
z² + 2z – 15 = (z – 3)(z + 5)
(z +3)(z² + 2z – 15) = (z+3)(z – 3)(z + 5)
Question 19.
81w4 − 16
Answer:
Determine whether the inverse of f is a function. Then find the inverse.
Question 20.
f(x) = \(\frac{3}{x+5}\)
Answer:
The inverse of function is g(x) = \(\frac { 3 }{ x } \) – 5
Explanation:
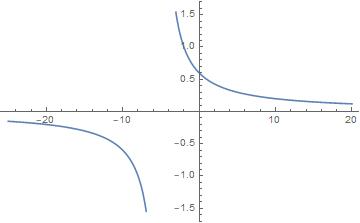
From the graph
y = \(\frac { 3 }{ x + 5 } \)
x = \(\frac { 3 }{ y + 5 } \)
x(y + 5) = 3
y + 5 = \(\frac { 3 }{ x } \)
y = \(\frac { 3 }{ x } \) – 5
Question 21.
f(x) = \(\frac{1}{2x-1}\)
Answer:
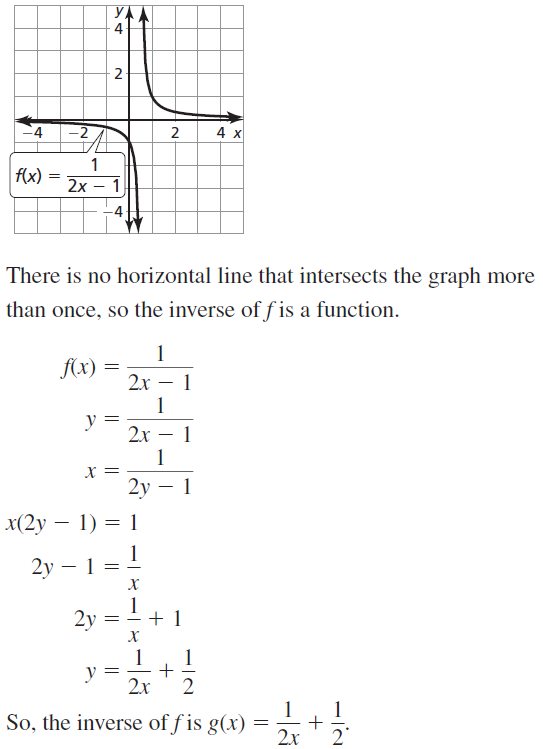
Question 22.
f(x) = \(\frac{2}{x}\) − 4
Answer:
The inverse of f(x) is g(x) = \(\frac { 2 }{ x + 4 } \)
Explanation:
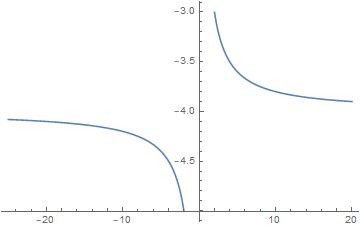
From the graph
y = \(\frac { 2 }{ x } \) – 4
x = \(\frac { 2 }{ y } \) – 4
x + 4 = \(\frac { 2 }{ y } \)
y(x + 4) = 2
y = \(\frac { 2 }{ x + 4 } \)
Question 23.
f(x) = \(\frac{3}{x^{2}}\) + 1
Answer:
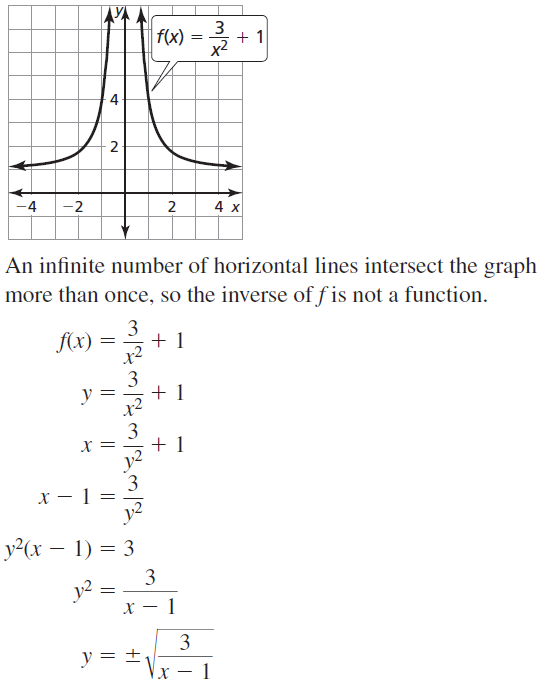
Data Analysis and Statistics Performance Task: Curving the Test
11.4–11.6 What Did You Learn?
Core Vocabulary
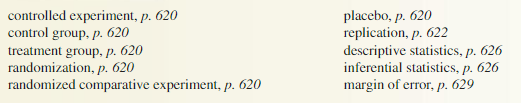
Core Concepts
Section 11.4
Randomization in Experiments and Observational Studies, p. 621
Comparative Studies and Causality, p. 621
Analyzing Experimental Designs, p. 622
Section 11.5
Estimating Population Parameters, p. 626
Analyzing Estimated Population Parameters, p. 628
Section 11.6
Experiments with Two Samples, p. 634
Resampling Data Using Simulations, p. 635
Making Inferences About Treatments, p. 636
Mathematical Practices
Question 1.
In Exercise 7 on page 623, find a partner and discuss your answers. What questions should you ask your partner to determine whether an observational study or an experiment is more appropriate?
Answer:
Question 2.
In Exercise 23 on page 632, how did you use the given interval to find the sample size?
Answer:
Performance Task: Curving the Test
Test scores are sometimes curved for different reasons using different techniques. Curving began with the assumption that a good test would result in scores that were normally distributed about a C average. Is this assumption valid? Are test scores in your class normally distributed? If not, how are they distributed? Which curving algorithms preserve the distribution and which algorithms change it?
To explore the answers to these questions and more, go to BigIdeasMath.com.
Data Analysis and Statistics Chapter Review
11.1 Using Normal Distributions (pp. 595–602)
Question 1.
A normal distribution has mean μ and standard deviation σ. An x-value is randomly selected from the distribution. Find P(x ≤ μ − 3σ).
Answer:
P(x ≤ μ – 3σ) = 0.0015
Explanation:
Find the probability P(x ≤ μ – 3σ)
P(x ≤ μ – 3σ) = \(\frac { 1 – 0.997 }{ 2 } \) = \(\frac { 0.003 }{ 2 } \)
= 0.0015
The probability is 0.0015
Question 2.
The scores received by juniors on the math portion of the PSAT are normally distributed with a mean of 48.6 and a standard deviation of 11.4. What is the probability that a randomly selected score is at least 76?
Answer:
P(x ≥76) = 0.0082
Explanation:
The scores received by juniors on the math portion of the PSAT are normally distributed with μ = 48.6, σ = 11.4
z = \(\frac { x – μ }{ σ } \)
P(x ≥76) = P(\(\frac { x – 48.6 }{ 11.4 } \)≥\(\frac { 76 – 48.6 }{ 11.4 } \))
= P(z≥2.4) = 1 – P(z≤2.4)
= 1 – 0.9918
= 0.0082
11.2 Populations, Samples, and Hypotheses (pp. 603−608)
Question 3.
To estimate the average number of miles driven by U.S. motorists each year, a researcher conducts a survey of 1000 drivers, records the number of miles they drive in a year, and then determines the average. Identify the population and the sample.
Answer:
In population of all motorist drivers in the US, a sample of 1000 drivers are surveyed.
Explanation:
Since the survey does not participate in all motorists from the US, we can conclude that in population of all motorist drivers in the US, a sample of 1000 drivers are surveyed.
Question 4.
A pitcher throws 40 fastballs in a game. A baseball analyst records the speeds of 10 fastballs and finds that the mean speed is 92.4 miles per hour. Is the mean speed a parameter or a statistic? Explain.
Answer:
Since we have an average speed of 10 fastballs of some pitcher, the mean value is calculated from a sample, not from the entire population. Thus, this average represents statistics.
Question 5.
A prize on a game show is placed behind either Door A or Door B. You suspect the prize is more often behind Door A. The show host claims the prize is randomly placed behind either door. What should you conclude when the prize is behind Door A for 32 out of 50 contestants?
Answer:
Since more than half of prizes for the customers are behind door A, the hosts claim that the prize is randomly placed behind either door is most likely false.
11.3 Collecting Data (pp. 609−616)
Question 6.
A researcher wants to determine how many people in a city support the construction of a new road connecting the high school to the north side of the city. Fifty residents from each side of the city are surveyed. Identify the type of sample described and determine whether the sample is biased.
Answer:
A stratified sample.
Explanation:
Fifty residents from each side of the city are surveyed to determine how many people in a city support the construction of a new road connecting the high school to the north side of the city. Thus, it is a stratified sample.
Question 7.
A researcher records the number of people who use a coupon when they dine at a certain restaurant. Identify the method of data collection.
Answer:
An observational study
Explanation:
It is an observational study because the researcher simply observes the subjects without interfering.
Question 8.
Explain why the survey question below may be biased or otherwise introduce bias into the survey. Then describe a way to correct the flaw.
“Do you think the city should replace the outdated police cars it is using?”
Answer:
The answer is biased. “Do you think the police should replace cars?”
Explanation:
The answer is biased because it is set in a way so that encourages the answer yes. The question can be set as “Do you think the police should replace cars?”
11.4 Experimental Design (pp. 619–624)
Question 9.
A restaurant manager wants to know which type of sandwich bread attracts the most repeat customers. Is the topic best investigated through an experiment or an observational study? Describe how you would design the experiment or observational study.
Answer:
An experimental study
Explanation:
We can do an experimental study for this problem. For example, suppose we have 5 types of sandwich bread available. Then we can make 5 randomly selected groups with the same number of people and sell each group a sandwich with a certain type of bread. Thus, for each group, note how many people came again to buy the same sandwich.
Question 10.
A researcher wants to test the effectiveness of a sleeping pill. Identify a potential problem, if any, with the experimental design below. Then describe how you can improve it.
The researcher asks for 16 volunteers who have insomnia. Eight volunteers are given the sleeping pill and the other 8 volunteers are given a placebo. Results are recorded for 1 month.
Answer:
Since the participants in the study are not randomly selected, they cannot represent the whole population. Thus, we must randomly select the members of the population for the study.
Question 11.
Determine whether the study is a randomized comparative experiment. If it is, describe the treatment, the treatment group, and the control group. If it is not, explain why not and discuss whether the conclusions drawn from the study are valid.
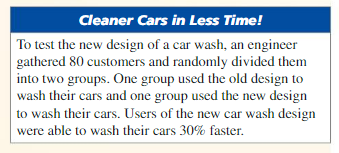
Answer:
It is a randomized comparative experiment.
Explanation:
It is a randomized comparative experiment because customers are randomly assigned to the control group or the treatment group. The treatment is a new design of a car wash. the treatment group is the group that using the new design to wash their cars and the control group will be a group that using the old design to wash their cars.
11.5 Making Inferences from Sample Surveys (pp. 625−632)
Question 12.
In a survey of 1017 U.S. adults, 62% said that they prefer saving money over spending it. Give an interval that is likely to contain the exact percent of all U.S. adults who prefer saving money over spending it.
Answer:
Between 65.1% t0 58.9%
Explanation:
Since in the survey participate n = 1017 U.S adults, the margin error will be
±\(\frac { 1 }{ √n } \) = ±\(\frac { 1 }{ √1017 } \) = ±0.031
Thus, the interval that is likely to contain the exact percentage of all adults from the U.S who prefer saving money over spending it will be
(62% + 3.1%, 62% – 3.1%) = (65.1%, 58.9%)
Thus, the interval is between 65.1% t0 58.9%
Question 13.
There are two candidates for homecoming king. The table shows the results from four random surveys of the students in the school. The students were asked whether they will vote for Candidate A.Do you think Candidate A will be the homecoming king? Explain.
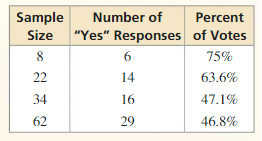
Answer:
When the sample size increases, it approaches 46.8%. Since that is less than 50% it is not as likely as the probability of candidate B winning homecoming king.
Explanation:
Sample size of 62 has 46.8% of voters saying yes. As the sample size increases, the percentage decreases.
11.6 Making Inferences from Experiments (pp. 633−638)
Question 14.
Describe how to use a simulation to resample the data in the example above. Explain how this allows you to make inferences about the data when the sample size is small.
Answer:
When the sample size is small, we can repeat this process more times and makes new control and new treatment groups, and see how often you get differences between the new groups that are at least as large as the one you measured.
Explanation:
Combine the measurements from both groups and assign a number to each value. Let the numbers 1 through 10 represent the data in the original control group, and let the numbers 11 through 20 represent the data in the original treatment group
| Control group | 4.5 | 4.5 | 4.8 | 4.4 | 4.4 | 4.7 | 4.3 | 4.5 | 4.1 | 4.2 |
| Assigned number | 1 | 2 | 3 | 4 | 5 | 6 | 7 | 8 | 9 | 10 |
| Treatment group | 4.6 | 4.8 | 5.0 | 4.8 | 4.7 | 4.6 | 4.9 | 4.9 | 4.8 | 4.4 |
| Assigned number | 11 | 12 | 13 | 14 | 15 | 16 | 17 | 18 | 19 | 20 |
Use a random generator. Randomly generate 20 numbers from 1 through 20 without repeating a number.
| 5 | 1 | 15 | 13 | 18 | 17 | 4 | 20 | 10 | 8 |
| 9 | 2 | 12 | 16 | 6 | 19 | 11 | 3 | 7 | 14 |
Use the first 10 numbers to make the new control group, and the next 10 to make the new treatment group.
| New control group | 4.4 | 4.5 | 4.7 | 5.0 | 4.9 | 4.9 | 4.4 | 4.4 | 4.2 | 4.5 |
| New treatment group | 4.1 | 4.5 | 4.8 | 4.6 | 4.7 | 4.8 | 4.6 | 4.8 | 4.3 | 4.8 |
Now let’s find the mean yields of the new control and treatment groups
μ<new control> = \(\frac { 1 }{ 10 } \)(4.4 + 4.5 + 4.7 + 5.0 + 4.9 + 4.9 + 4.4 + 4.4 + 4.2 + 4.5)
= 4.59
μ<new treatment> = \(\frac { 1 }{ 10 } \)(4.1 + 4.5 + 4.8 + 4.6 + 4.7 + 4.8 + 4.6 + 4.8 + 4.3 + 4.8)
= 4.6
So, μ<new treatment> – μ<new control> = 4.6 – 4.59 = 0.01
This is less than the experimental difference in the given example
When the sample size is small, we can repeat this process more times and makes new control and new treatment groups, and see how often you get differences between the new groups that are at leat as large as the one you measured.
Data Analysis and Statistics Chapter Test
Question 1.
Market researchers want to know whether more men or women buy their product. Explain whether this research topic is best investigated through an experiment or an observational study. Then describe the design of the experiment or observational study.
Answer:
An observational study.
Explanation:
For the researcher, it is best investigated through an observational study because random samples of customers can be selected for the groups being studied. For example, we can record every the customer who buys the product and record if he was a women or men.
Question 2.
You want to survey 100 of the 2774 four-year colleges in the United States about their tuition cost. Describe a method for selecting a random sample of colleges to survey.
Answer:
We assign one integer from to each college. Now, using a random integer generator, we can select numbers from to and make a random sample of 100 colleges that match a random sample of numbers.
Explanation:
Of the four-year colleges in the United States, we must randomly select colleges. Therefore, we assign one integer from to each college. Now, using a random integer generator, we can select numbers from to and make a random sample of 100 colleges that match a random sample of numbers.
Question 3.
The grade point averages of all the students in a high school are normally distributed with a mean of 2.95 and a standard deviation of 0.72. Are these numerical values parameters or statistics? Explain.
Answer:
Parameters.
Explanation:
Since these values represent the mean and standard deviation of all the students in a high school, these values represent parameters because they are calculated from the entire population.
A normal distribution has a mean of 72 and a standard deviation of 5. Find the probability that a randomly selected x-value from the distribution is in the given interval.
Question 4.
between 67 and 77
Answer:
The probability is 0.68
Explanation:
Let’s suppose that a normal distribution has a mean of 72 and a standard deviation of 5.
z = \(\frac { x – μ }{ σ } \)
P(67≤x≤77) = P(\(\frac { 67 – 72 }{ 5 } \)≤ \(\frac { x – 72 }{ 5 } \) ≤\(\frac { 77 – 72 }{ 5 } \))
= P(-1≤z≤1) = P(z<1) – P(z<-1)
= 0.8413 – 0.1587 = 0.6826
The probability is 0.68
Question 5.
at least 75
Answer:
The probability is 0.975
Explanation:
Let’s suppose that a normal distribution has a mean of 72 and a standard deviation of 5.
82 – μ = 82 – 72 = 10 = 2 . 5 = 2σ
10 = μ – 2σ
P(x≤82) = P(x≤μ – 2σ) = 0.5 + \(\frac { 0.95 }{ 2 } \)
= 0.5 + 0.475 = 0.975
The probability is 0.975
Question 6.
at most 82
Answer:
The probability is 0.2743
Explanation:
Let’s suppose that a normal distribution has a mean of 72 and a standard deviation of 5.
z = \(\frac { x – μ }{ σ } \)
P(x≥75) = P(\(\frac { x – 72 }{ 5 } \)≥ \(\frac { 75 – 72 }{ 5 } \))
= P(z≥0.6) = 1 – P(z< 0.6)
= 1 – 0.7257
= 0.2743
The probability is 0.2743
Question 7.
A researcher wants to test the effectiveness of a new medication designed to lower blood pressure. Identify a potential problem, if any, with the experimental design. Then describe how you can improve it.
The researcher identifies 30 people with high blood pressure. Fifteen people with the highest blood pressures are given the medication and the other 15 are given a placebo. After 1 month, the subjects are evaluated.
Answer:
Since 15 people with the highest blood pressure are assigned into one group, we can notice that people are not randomly assigned. Thus, to fix this problem, we can randomly form two groups of 15 people, and then one group will take the medicine and another one will take placebo.
Question 8.
A randomized comparative experiment tests whether a vitamin supplement increases human bone density (in grams per square centimeter). The control group has eight people and the treatment group, which receives the vitamin supplement, has eight people. The table shows the results.
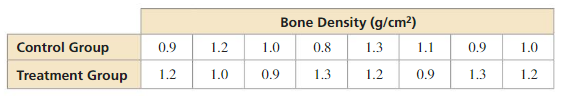
a. Find the mean yields of the control group, \(\bar{x}_{\text {control }}\), and the treatment group, \(\bar{x}_{\text {treatment }}\).
b. Find the experimental difference of the means, \(\bar{x}_{\text {treatment }}-\bar{x}_{\text {control }}\).
c. Display the data in a double dot plot. What can you conclude?
d. Five hundred resamplings of the data are simulated. Out of the 500 resampling differences, 231 are greater than the experimental difference in part (b). What can you conclude about the hypothesis, The vitamin supplement has no effect on human bone density? Explain your reasoning.
Answer:
a. μ<control> = 1.025
μ<treatment> = 1.125
b. μ<treatment> – μ<control> = 0.1
d. The hypothesis is probably true.
Explanation:
a. μ<control> = \(\frac { 1 }{ 8 } \)(0.9 + 1.2 + 1.0 + 0.8 + 1.3 + 1.1 + 0.9 + 1.0)
= 1.025
μ<treatment> = \(\frac { 1 }{ 8 } \)(1.2 + 1.0 + 0.9 + 1.3 + 1.2 + 0.9 + 1.3 + 1.2)
= 1.125
b. μ<treatment> – μ<control> = 1.125 – 1.025 = 0.1
c. The double dot plot is
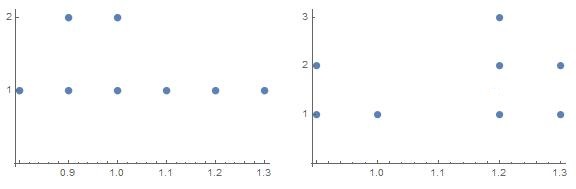
d. The hypothesis which claims that vitamin supplement has no effect on human bone density assumes that the difference of the means is equal to 0. Now, from 500 resampling differences, 231 are greater than the experimental differences in part b, which is 0.1. Now this implies that more than half of the resamplings are less than 0.1, which is less than one SD. So, the hypothesis is probably true.
Question 9.
In a recent survey of 1600 randomly selected U.S. adults, 81% said they have purchased a product online.
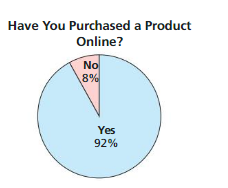
a. Identify the population and the sample. Describe the sample.
b. Find the margin of error for the survey.
c. Give an interval that is likely to contain the exact percent of all U.S. adults who have purchased a product online.
d. You survey 75 teachers at your school. The results are shown in the graph. Would you use the recent survey or your survey to estimate the percent of U.S. adults who have purchased a product online? Explain.
Answer:
a. Population represent all U.S adults. A sample is 1600 adults that participate in the survey
b. The margin error will be ±2.5%
c. The interval is between 78.5% to 83.5%.
d. A recent survey.
Explanation:
a. In the population of all U.S adults a sample of 1600 randomly selected adults have participated in the survey
b. Since in the survey participate n = 1600 U.S adults, the margin error will be
±\(\frac { 1 }{ √n } \) = ±\(\frac { 1 }{ √1600 } \) = ±0.025
The margin error will be ±2.5%
c. Thus the interval that is likely to contain the exact percentage of all adults from the U.S who said that they have purchased a product online will be
(81% – 2.5%, 81% + 2.5%) = (78.5%, 83.5%)
The interval is between 78.5% to 83.5%.
d. Since, we are surveyed only the teachers from one school we cannot use this survey because it cannot represent the entire population. So, we will use a recent survey.
Data Analysis and Statistics Cumulative Assessment
Question 1.
Your friend claims any system formed by three of the following equations will have exactly one solution.
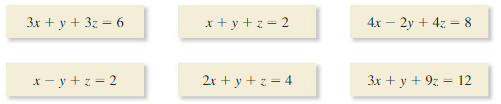
a. Write a linear system that would support your friend’s claim.
b. Write a linear system that shows your friend’s claim is incorrect.
Answer:
a. Each of the given equations represent a plane equation. A system of 3 equation will have one solution if these planes intersect at one point.
3x + y + 3z = 6 — (i)
x + y + z = 2 — (ii)
3x + y + 9z = 12 — (iii)
We can write 2nd equation as y = 2 – x – z
Change the first & third equations
3x + 2 – x – z + 3z = 6
2x + 2z = 4 — (iv)
3x + 2 – x – z +9z = 12
2x + 8z = 10 — (v)
Subtrcat (iv) & (v)
2x + 8z – 2x – 2z = 10 – 4
6z = 6
z = 1
Put z = 1 in (iv)
2x + 2 = 4
x = 1
Put x, z values in y = 2 – x – z
y = 2 – 1 – 1
y = 0
Hence, the solution of the system is (x, y, z) = (1, 0, 1) and the friend’s calim is correct. There is only one solution to the system.
b. To prove thae claim is incorrect, take the following equations
3x + y + 3z = 6 — (i)
x + y + z = 2 — (ii)
4x – 2y + 4z = 8 — (iii)
We can write 2nd equation as y = 2 – x – z
Change the first & third equations
3x + 2 – x – z + 3z = 6
2x + 2z = 4
x + z = 2— (iv)
4x – 2(2 – x – z) + 4z = 8
4x – 4 + 2x + 2z + 4z = 8
6x + 6z = 12
x + z = 2 — (v)
As both (iv), v are same, the equation has many solutions
y = 2 – 2
y = 0
Hence, the system has infinitely many solutions (x, y , z) = (2 – z, 0, z) and the friend’s claim is incorrect.
Question 2.
Which of the following samples are biased? If the sample is biased, explain why it is biased.
A. A restaurant asks customers to participate in a survey about the food sold at the restaurant. The restaurant uses the surveys that are returned.
B. You want to know the favorite sport of students at your school. You randomly select athletes to survey at the winter sports banquet.
C. The owner of a store wants to know whether the store should stay open 1 hour later each night. Each cashier surveys every fifth customer.
D. The owner of a movie theater wants to know whether the volume of its movies is too loud. Patrons under the age of 18 are randomly surveyed.
Answer:
a. Biased
b. Biased
c. NonBiased
d. Biased
Explanation:
a. The sample is biased because only customers with strong opinions will return the survey
b. The sample is biased because the survey doesn’t participate randomly selected students.
c. The sample is nonbiased because in the survey participates randomly selected customers.
d. The sample is biased because only patrobs under the age of 18 participate in the survey.
Question 3.
A survey asks adults about their favorite way to eat ice cream. The results of the survey are displayed in the table shown.
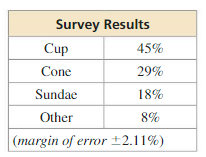
a. How many people were surveyed?
b. Why might the conclusion, “Adults generally do not prefer to eat their ice cream in a cone” be inaccurate to draw from this data?
c. You decide to test the results of the poll by surveying adults chosen at random. What is the probability that at least three out of the six people you survey prefer to eat ice cream in a cone?
d. Four of the six respondents in your study said they prefer to eat their ice cream in a cone. You conclude that the other survey is inaccurate. Why might this conclusion be incorrect?
e. What is the margin of error for your survey?
Answer:
a. 2246
b. The conclusion is inaccurate
c. 0.2374
d. Conclusion is wrong
e. ±40.82
Explanation:
a. Given that,
Margin error = ±2.11
±0.0211 = ±\(\frac { 1 }{ √n } \)
(±0.0211)² = (±\(\frac { 1 }{ √n } \))²
0.000445 = \(\frac { 1 }{ n } \)
n = 2246
b. From the result if the survey we see that people prefer different types of ice cream with different percentages and as 2915 of people prefer ice cream in a cone, we cannot conclude that in general people donot eat ice cream in a cone.
c. from the result of the survey we see that 29%of people prefer ice cream in acone. So we can compute the probability that a person chooses ice cream in the cone and the probability that doesn’t choose ice cream in the cone
A: “A person prefer to eat ice cream in a cone”
B: “A person doesn’t prefer to eat ice cream in a cone”
P(A) = \(\frac { 29 }{ 100 } \) = 0.291
P(B) = 1 – P(A) = 1 – 0.29 = 0.71
P(X≥3) = 1 – P(X<3)
= 1 – P(X = 2) – P(x = 1) – P(X = 0)
P(X = 2) = 0.3206
P(X = 1) = 0.3139
P(X = 0) = 0.1281
P(X≥3) = 1 – 0.3206 – 0.3139 – 0.1281
= 0.2374
d. The conclusion might wrong, because in your survey, we have only 6 persons that participte and since the sample size is too samll, we cannot conclude that the other survey is inaccurate.
e. The sample size of our survey is 6
The margin error = ±\(\frac { 1 }{ √n } \)
= ±\(\frac { 1 }{ √6 } \)
= ±0.4082
The margin error is ±40.82%
Question 4.
You are making a lampshade out of fabric for the lamp shown. The pattern for the lampshade is shown in the diagram on the left.
a. Use the smaller sector to write an equation that relates θ and x.
b. Use the larger sector to write an equation that relates θ and x+ 10.
c. Solve the system of equations from parts (a) and (b) for x and θ.
d. Find the amount of fabric (in square inches) that you will use to make the lampshade.
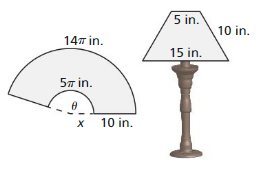
Answer:
a. θ = \(\frac { 5π }{ x } \)
b. θ = \(\frac { 14π }{ x + 10} \)
c. x = 5.56, θ = 2.82
d. 298.17
Explanation:
a. r = x, s = 5π
Arc length s = rθ
5π = x . θ
θ = \(\frac { 5π }{ x } \)
b. r = x + 10, s = 14π
Arc length s = rθ
14π = (x + 10)θ
θ = \(\frac { 14π }{ x + 10 } \)
c. From a and b
θ = \(\frac { 5π }{ x } \)
θ = \(\frac { 14π }{ x + 10 } \)
\(\frac { 5π }{ x } \) = \(\frac { 14π }{ x + 10 } \)
5(x + 10) = 14
5x + 50 = 14
x = 5.56
θ = \(\frac { 5π }{ 5.56 } \)
= 2.82 radians
d. Area = \(\frac { 1 }{ 2 } \)r²θ
A<G> = \(\frac { 1 }{ 2 } \)(5.56 + 10)² . 2.82
= \(\frac { 1 }{ 2 } \) . 242.11 . 2.82
= 341.76
A<S> = \(\frac { 1 }{ 2 } \)r²θ
= \(\frac { 1 }{ 2 } \) . (5.56)² . 2.82
= \(\frac { 1 }{ 2 } \) . 30.91 . 2.82
= 43.59
A = A<G> – A<S>
= 341.76 – 43.59
= 298.17
Question 5.
For all students taking the Medical College Admission Test over a period of 3 years, the mean score was 25.1. During the same 3 years, a group of 1000 students who took the test had a mean score of 25.3. Classify each mean as a parameter or a statistic. Explain.
Answer:
25.1 Parameter
25.3 statistic
Explanation:
The mean score of 25.1 is computed from the all students from the college. So, it is a parameter and the mean score of 25.3 is computed from a sample of 1000 students. So, it is a statistic.
Question 6.
Complete the table for the four equations. Explain your reasoning.
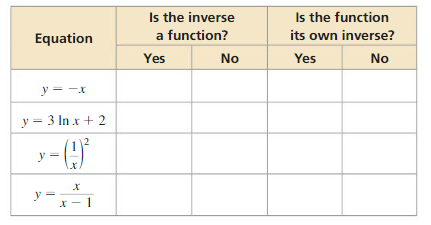
Answer:
Question 7.
The normal distribution shown has mean 63 and standard deviation 8. Find the percent of the area under the normal curve that is represented by the shaded region. Then describe another interval underthe normal curve that has the same area.
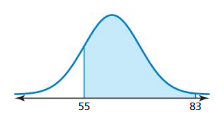
Answer:
The probability is 0.84.
Explanation:
P(55≤x≤83) = P(\(\frac { 55 – 63 }{ 8 } \) ≤\(\frac { x – 63 }{ 8 } \) ≤\(\frac { 83 – 63 }{ 8 } \))
= P(-1 ≤z≤2.5) = P(z<2.5) – P(z<-1)
= 0.9938 – 0.1587 = 0.84
Question 8.
Which of the rational expressions cannot be simplified? (HSA-APR.D.6)
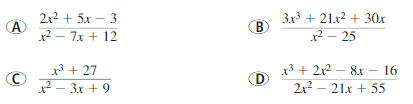
Answer:
We can’t simplify the expressions.
Explanation:
A. Factors of 2x² + 5x – 3 = 0
= \(\frac { -5 ± √(25 – 4 . 2 . (-3))}{ 2 . 2 } \)
= \(\frac { -5 ± √(25 + 24)}{ 4 } \)
= \(\frac { -5 ± 7}{ 4 } \)
The solutions are \(\frac { 1 }{ 2 } \), -3
2x² + 5x – 3 = 2(x – \(\frac { 1 }{ 2 } \)) (x + 3)
Factors of x² – 7x + 12 = 0
= \(\frac { -(-7) ± √(49 – 4 . 1 . 12)}{ 2 . 1 } \)
= \(\frac { 7 ± √(49 – 48)}{ 2 } \)
= \(\frac { 7 ± 1}{ 2 } \)
The solutions are 4, 3
x² – 7x + 12 = (x – 4)(x – 3)
\(\frac { 2x² + 5x – 3 }{ x² – 7x + 12 } \)= \(\frac { 2(x – 1/2)(x + 3) }{ (x – 4)(x – 3) } \)